Project Management Dashboard
The Project Management Dashboard makes it easier to review a portfolio of projects at once using a variety of prompts. This dashboard will offer fund managers one place to do things like review all faculty startup and retention funds or their department’s operating funds, close out expired projects, and analyze a PI’s portfolio.
The Project Management Dashboard is available from the Business Analytics Hub (bah.ucsd.edu) under the Financial Management tab.
The dashboard includes:
- Summary
- Commitment Details
- Variances
- DOPES
- Payroll by Earnings Month
- Payroll Projections
- Expenditures by month
- High Risk Ledger Review
- Project COA Lookup
- Pending Costs
Report Demo
You can find the Project Management Dashboard Report Demo on the Budget & Finance MediaSpace channel - Financial Report Demos playlist.
Access
Access has been provisioned to anyone with the Oracle BI Consumer JR role. (Staff who do not have access should request the Oracle role.) Access failure appears as error "Unable to load requested view. Displaying home view instead.". To access the dashboard:
- Navigate to bah.ucsd.edu.
- Select Budget & Finance.
- If using the List View, look for Project Management Dashboard in the list or use the search bar at the top right and click the dashboard name
- If using the Card View, click the Financial Management tab and click Launch on the Project Management Dashboard tile
- Use your Active Directory credentials to sign in, if prompted.
Navigation
The Cognos and Oracle Tips & Tricks page shares various recommendations on navigating report functionality
- Horizontal tabs at the top of the report under the Project Management Dashboard heading can be used to run each report
![]()
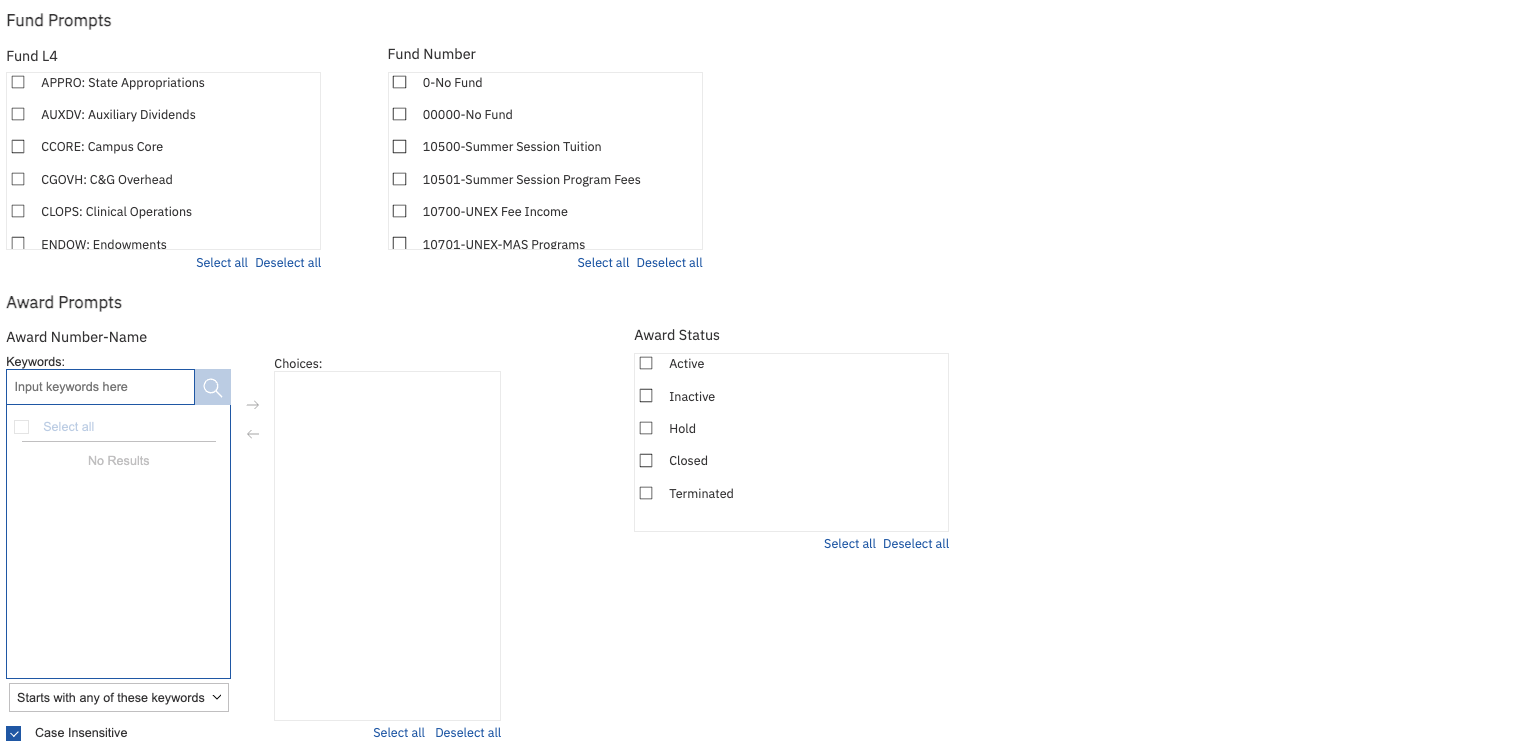
- Use these parameters to filter for the data you want to view
- These filters can be used in combination or individually to produce desired results
- Use the ‘Quick Prompts’ section to quickly enter a single value for Financial Unit, Project, Project-Task, and/or Fund.
Time and Display Prompts
| Prompt | What to Know |
|---|---|
| Costs and Commitments through Period End Date |
|
| Non-Sponsored Task End Date |
|
| Show Direct/Indirect |
|
| Show Budget Period |
|
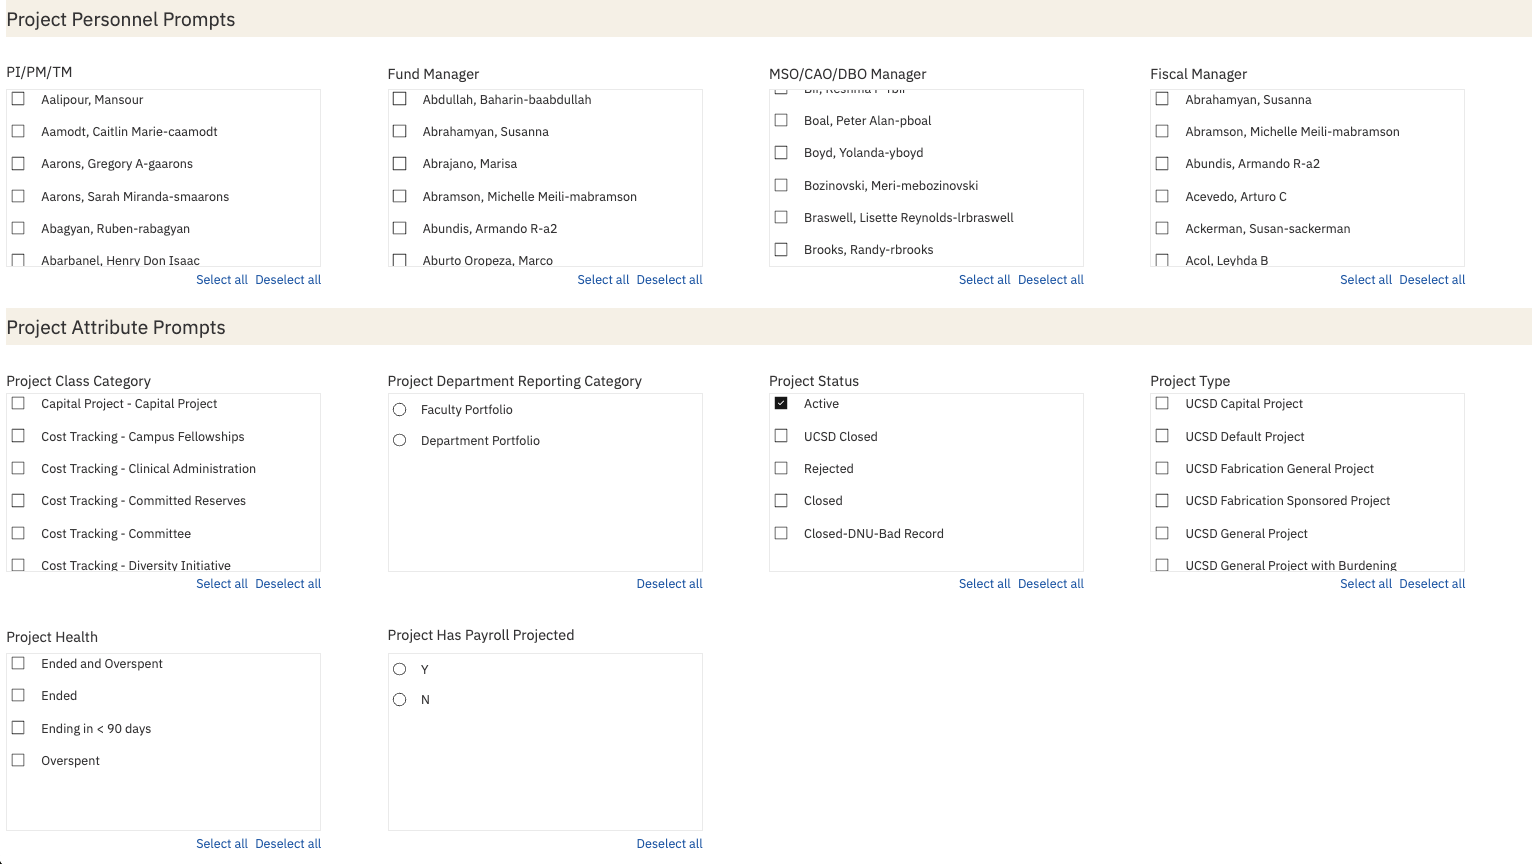
Project Attribute Prompts
| Prompt | What to Know |
|---|---|
| Project Class Category |
|
| Project Status |
|
| Project Health |
|
| Project Has Payroll Projected |
|
Summary
Business Scenarios
- What actions do I need to take on my projects?
- What are the balances on my projects that are ending soon?
- Which projects are overspent or ended and need to be closed?
- What are the balances of my projects after planned payroll? Does payroll need to be adjusted to prevent overspending or underspending?
- Do adjustments need to be made to projects that are being overspent or underspent?
- Are funds available that need to be added to the project budget?
- What are the balances on my non-sponsored projects and tasks?
Report Views
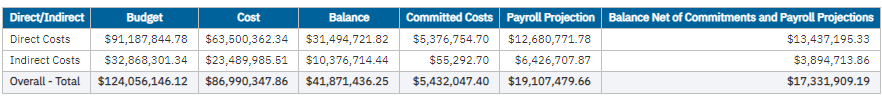
- Summary displays a high level view of a project portfolio consisting of Sponsored Projects and Non-sponsored projects. Both GL-based and PPM-based balances are displayed for non-sponsored projects.
- See Faculty and Researcher page for more information about the Sponsored Projects view and differences between GL-based reporting and PPM-based reporting.
- The dashboard displays financial statement signage. Positive balances represent funds available to spend. Positive resources and non-operating transfers represent an increase in funds. Positive expenses represent a decrease in funds.
- Refer to the Data Glossary under Get Started on the main BI & Financial Reporting Blink menu for searchable data descriptions and usage rules.
- There are two on-page prompts so you can adjust settings without returning to the prompt page:
- Period End Date
- PI/Project Manager/Task Manager

Sponsored Projects
- The Sponsored Projects view can be changed on the page, with four options to choose from.
Default view displays only the current budget period, or the last budget period for ended awards. The Carryforward Balance column indicates the balance as of the end of the last budget period. The Budget and Cost columns include only the current period budget and costs. The Balance is calculated as the Carryforward Balance plus Budget (current period) minus Costs (current period).
The default view displays separate rows for Direct Costs and Indirect Costs, but this can be changed to show only a single row per task with total costs.
An alternate view without budget period displays the budget and costs for the life of the award, with the balance calculated as Budget minus Costs.
This view can also be displayed with separate rows for Direct Costs and Indirect Costs or with total costs in a single row per task.
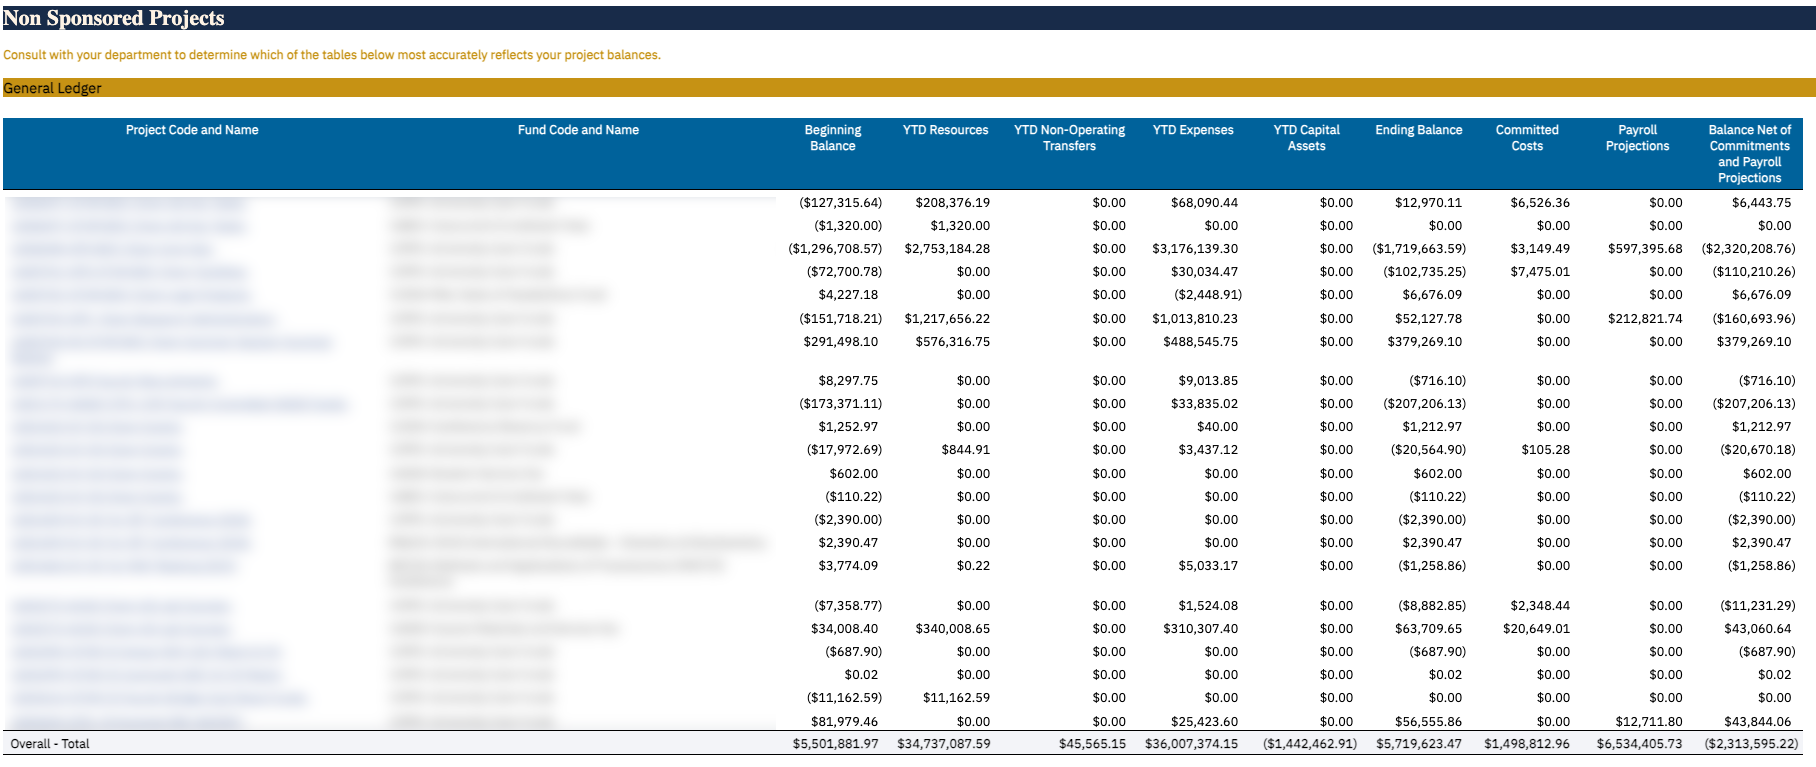
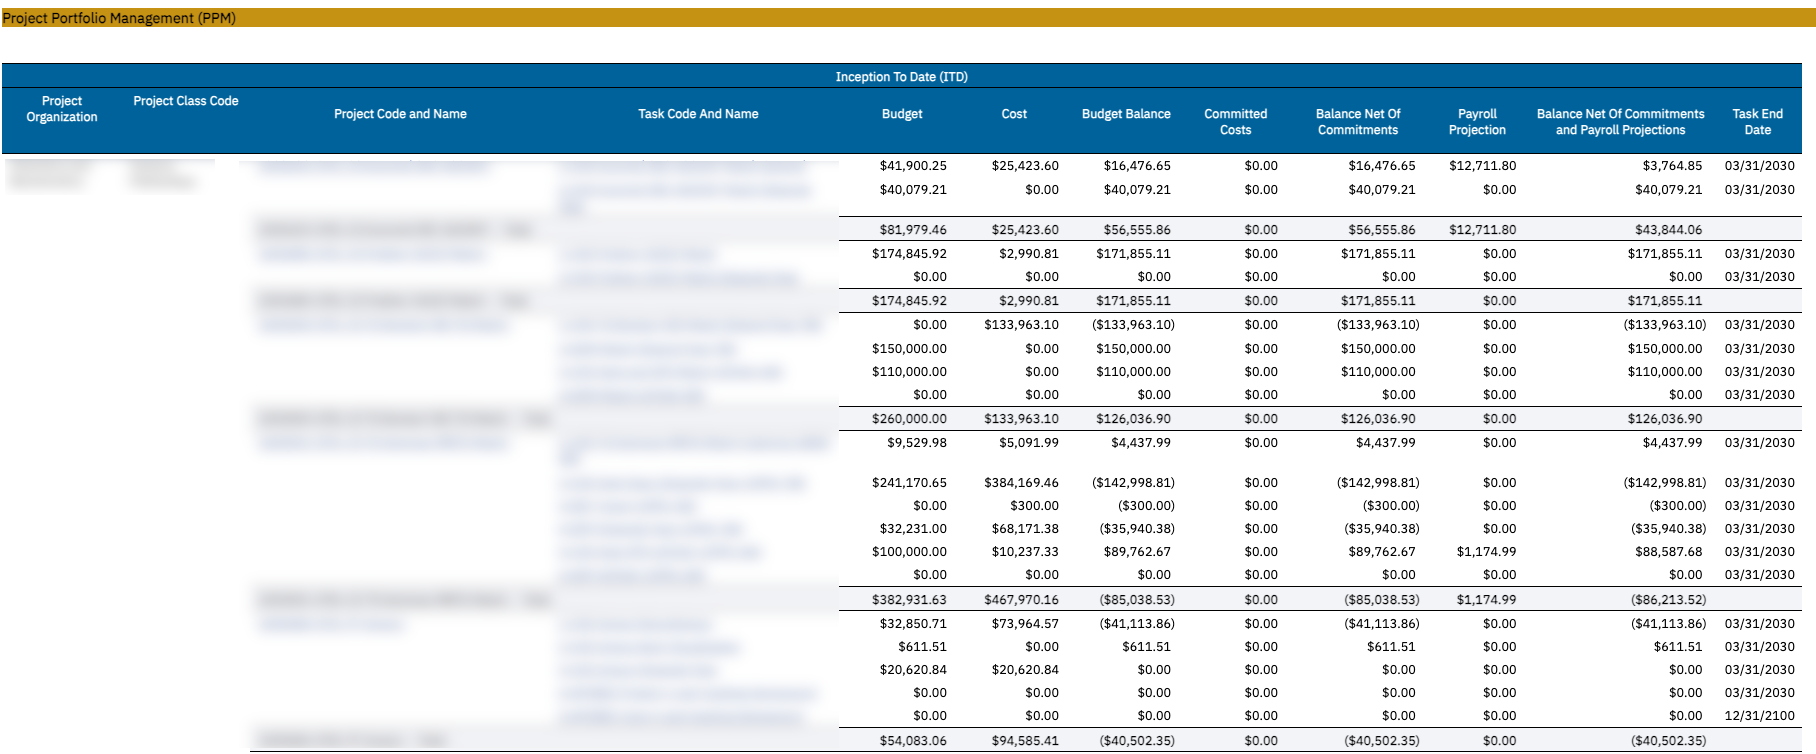
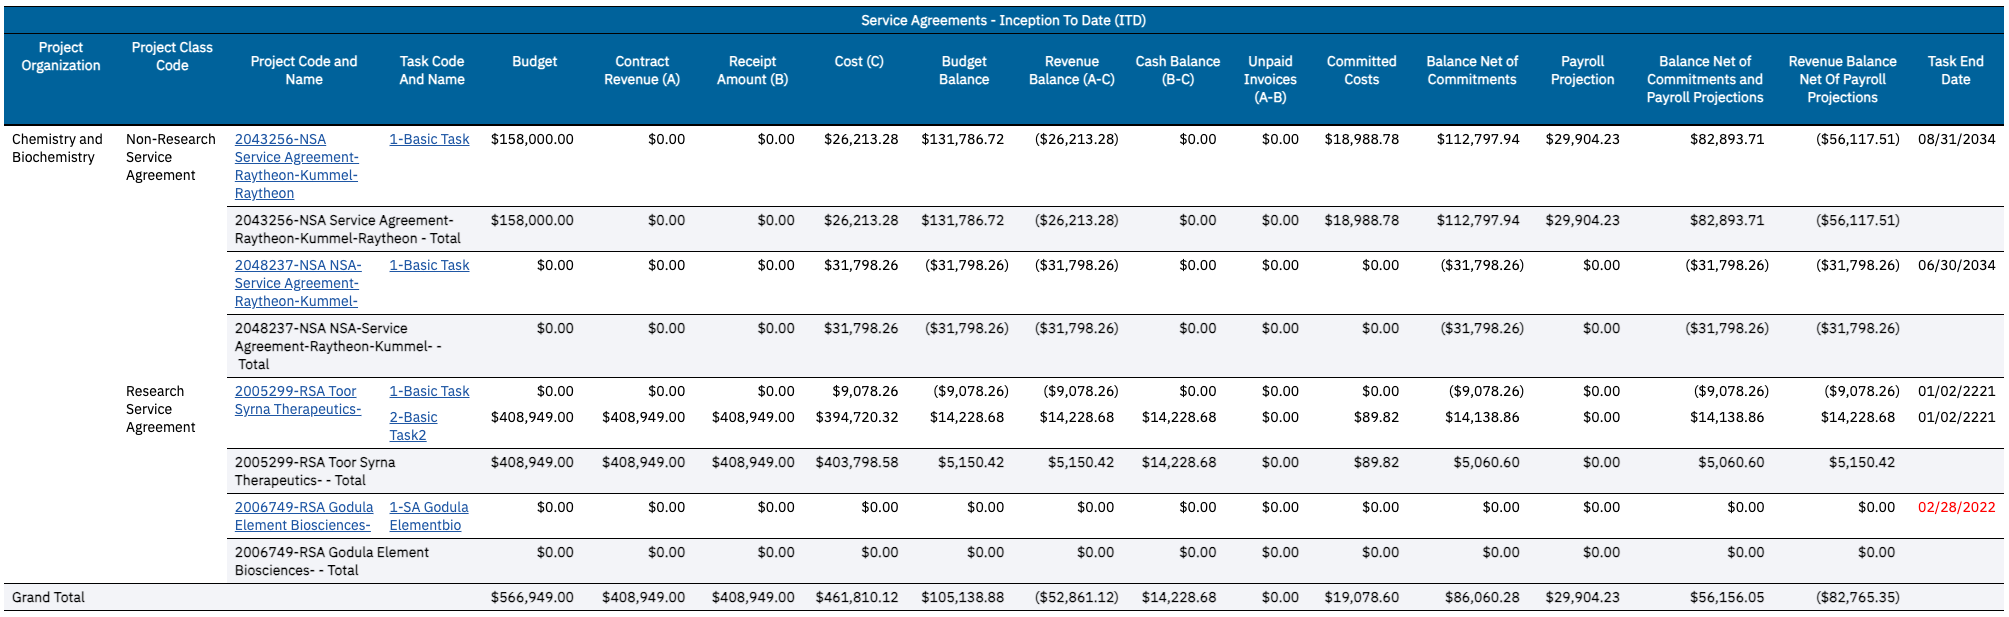
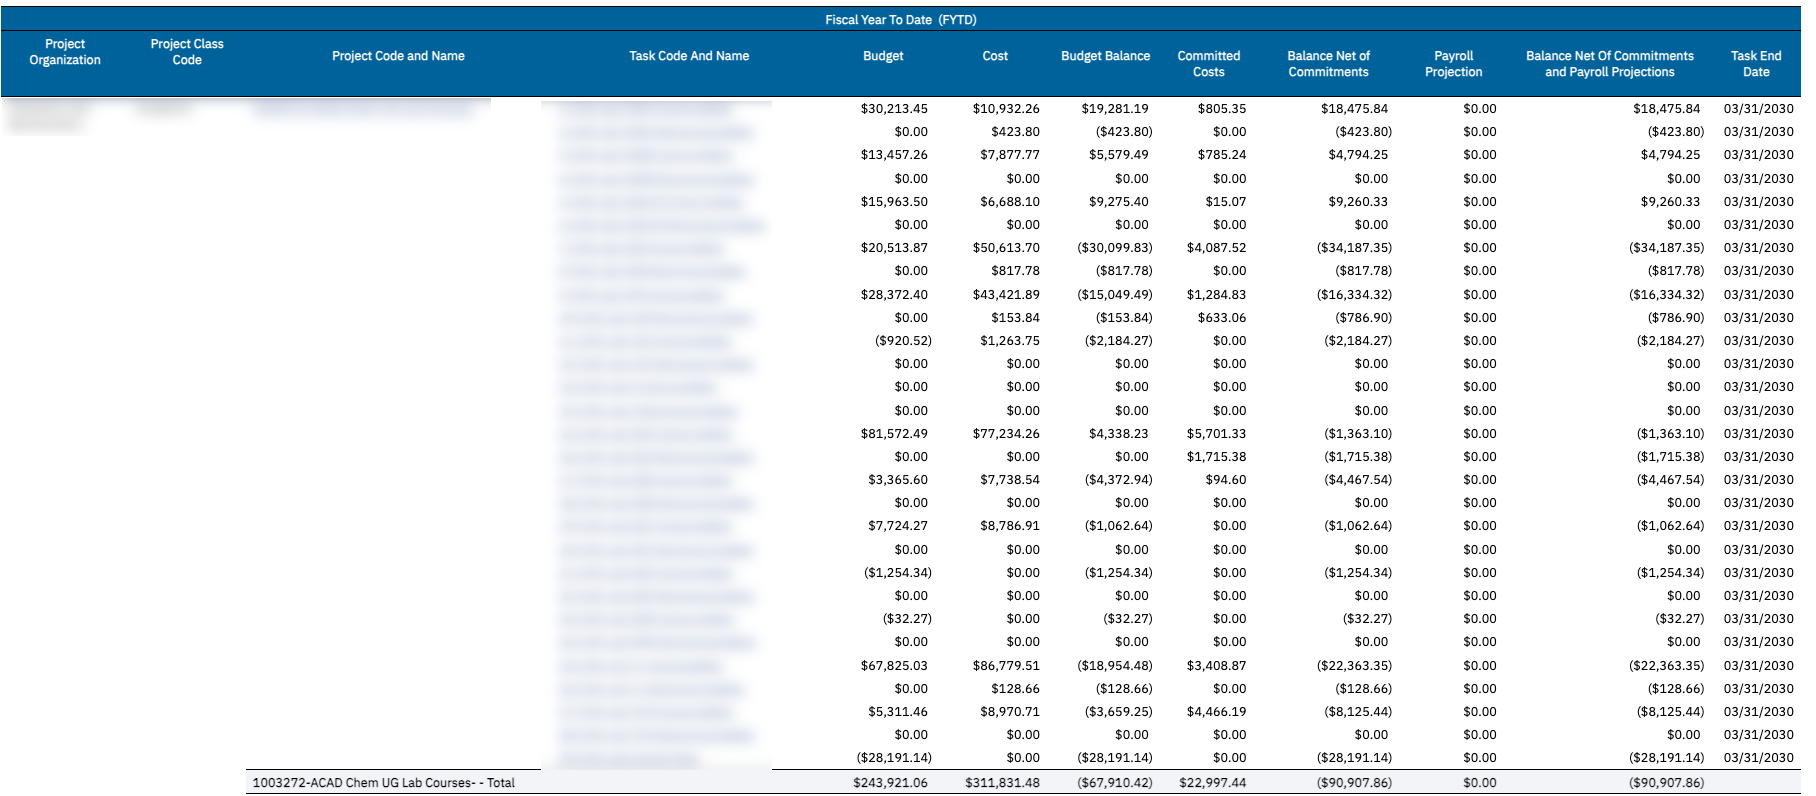
Non Sponsored Projects
- Both GL-based and PPM-based balances are displayed for non-sponsored projects.
- PPM-based balances for non-sponsored projects are displayed in four separate tables depending on project classifications (only a subset of the four tables may display depending on the projects in the portfolio). Generally, projects for annual operations are reported on a year-to-date basis and projects funded one time or irregularly are reported on an inception-to-date basis. Line of Service projects are reported year-to-date but include an informational column for Contract Revenue. Service Agreement projects are reported inception-to-date and include balance calculations based on both the Budget Amount and the Contract Revenue Amount. See Balance Calculations for more information.
- End dates displayed in red shows dates that have passed.
- Cash Balance: This represents the amount of cash available for spending on the chartstring. It is calculated as the Receipt Amount - Cost.
Commitment Details
More information about this section can be found in the Transaction Details report blink page.
Variances
Business Scenarios
- Are there GL-PPM differences or payroll costs sitting on default project that are causing my sponsored project balances to be inaccurate?
- Have award increments been obligated in Kuali but not yet reflected in Oracle?
- Have award increments been funded in Oracle but not yet reflected in a project budget?
Report Views
Misplaced Costs on Sponsored Projects:
- Expenses Only in GL: Displays expenses in General Ledger that should post to PPM. Click the amount to view details on the GL-PPM Reconciliation report.
- Refer to the Data Glossary under Get Started on the main BI & Financial Reporting Blink menu for searchable data descriptions and usage rules.
- The table on the right, 'People on Default', includes default project payroll related to all projects and tasks in the portfolio, payroll for the selected PI/PM/TM, and payroll for any individuals supervised by the PI/PM/TM. Click the amount to view details on the Default Project Payroll report.

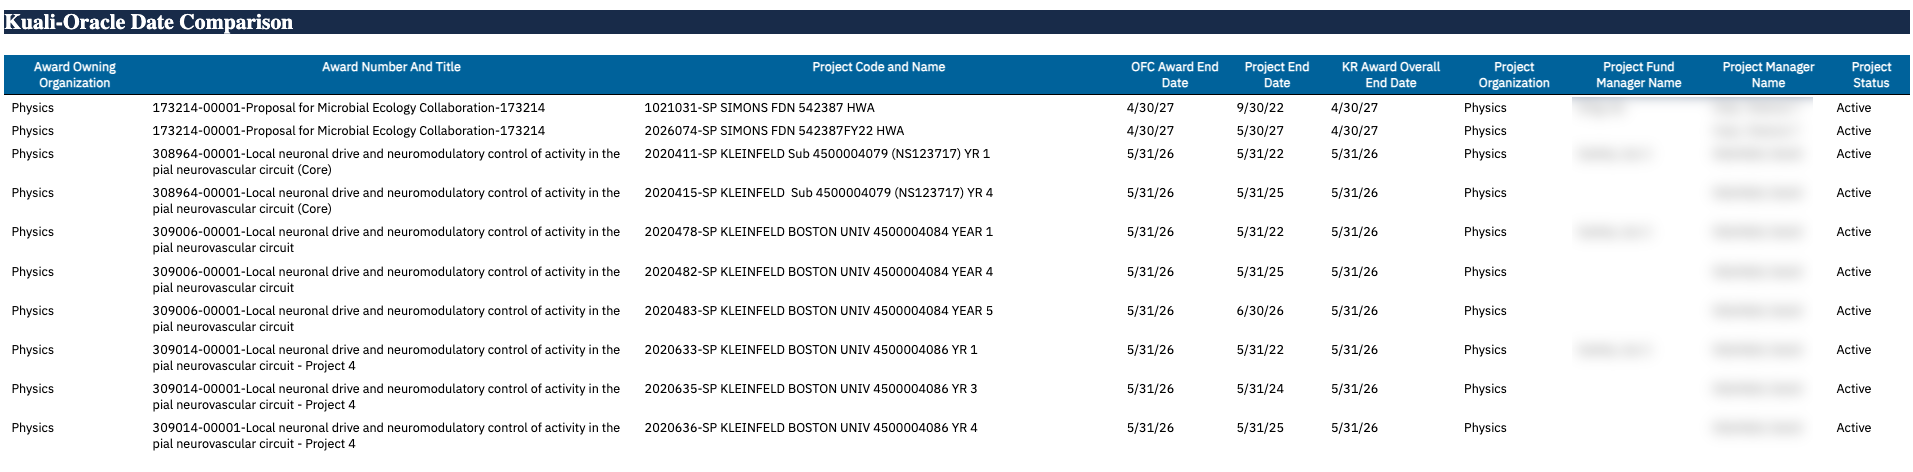
Kuali Oracle Comparison:
- This table compares amounts obligated in Kuali Award to Oracle Award Funding Amounts (external funding only), as well as Project Funding Amounts with Project Budget Amounts.
- This table only shows variances. If an award/project does not have any differences, the row will not appear.
- If Kuali Obligated to Date Amount and Oracle Award External Funding Amount have differences, it may indicate that award funding amounts have not been updated in Oracle Financials.
- If Project Funding and Project Budget Amounts have differences, the Project Unbudgeted Amount shows available amounts to be budgeted for a project.
- Project Status prompt parameter is defaulted to Active, but can be changed on the prompt page. See Prompts under Navigation for more information.
- An additional table is available to help identify discrepancies between award dates in Kuali and Oracle.
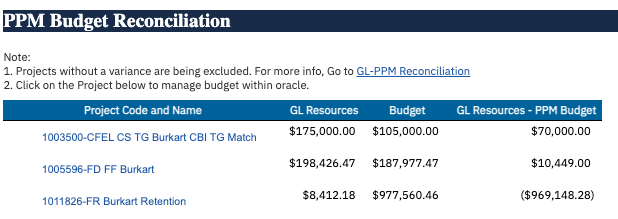
PPM Budget Reconciliation:
- Table that shows budget discrepancies between GL and PPM. Clicking on the project will send you to the Manage Budget screen in Oracle.
IDC Variances:
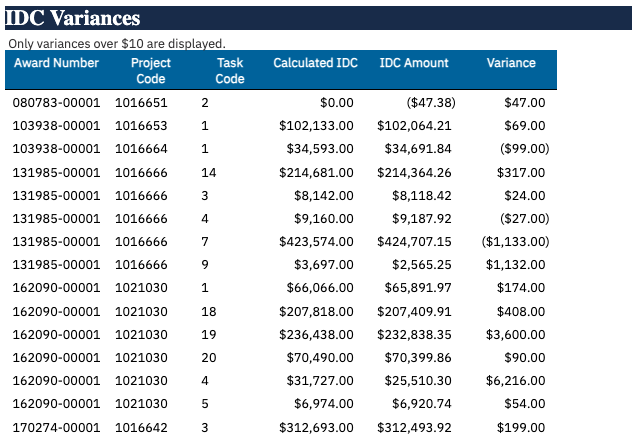
- Calculated IDC: Multiplies the cost amount of expenditures that are subject to IDC by the effective burden schedule multiplier. The list of expenditure types subject to IDC as well as the multiplier are governed by the burden schedule assigned to the award. The multiplier may vary based on the expenditure item date. Only expenditures with an expenditure item date on or after 7/1/2020 are included.
- IDC Amount: Amount on expenditure types starting with 508000. Only expenditures with an expenditure item date on or after 7/1/2020 are included.
- Variance: Calculated IDC - IDC Amount
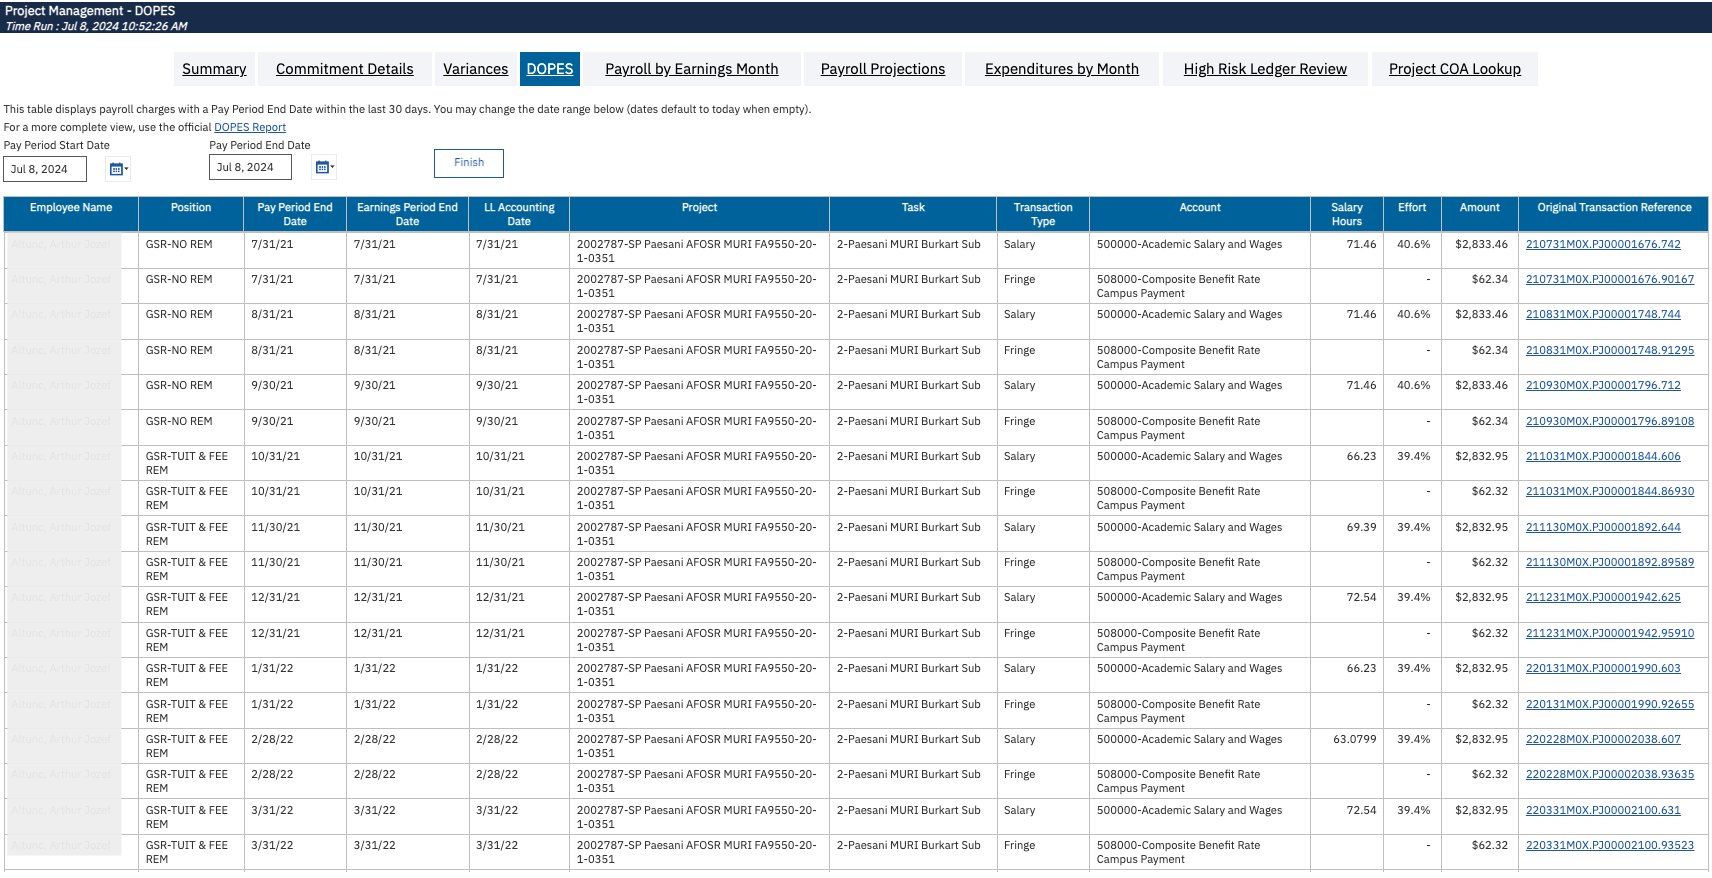
DOPES
Business Scenarios
- Complete monthly payroll reconciliation
Report Views
- The report defaults to displaying payroll that posted in the last 30 days. The date range can be changed by entering different to and from dates at the top of the report.
- Refer to the Data Glossary under Get Started on the main BI & Financial Reporting Blink menu for searchable data descriptions and usage rules.
- Click on the Original Transaction Reference number to view the corresponding Oracle transaction on the Transaction Details report.
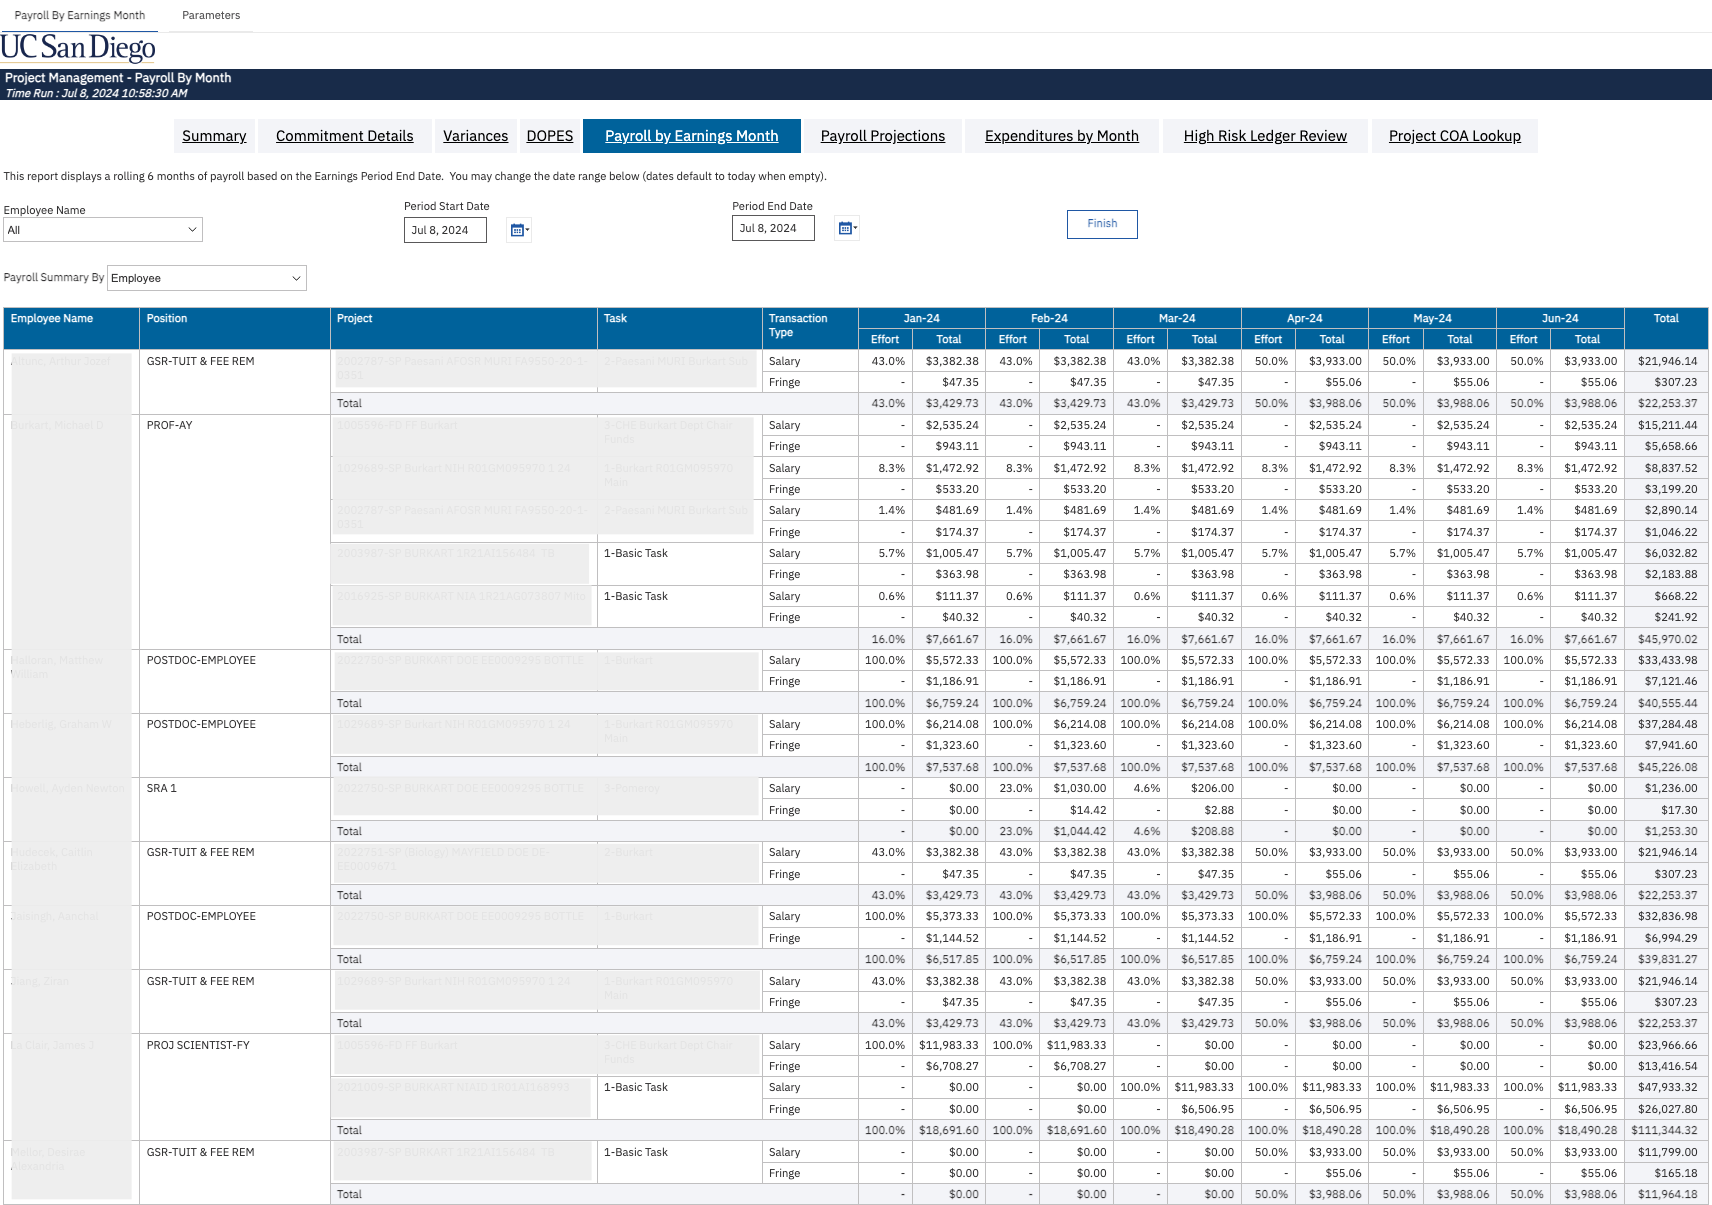
Payroll by Earnings Month
Business Scenarios
- View a big picture display of payroll based on earnings period
- Provide faculty with a view of how their people were funded over time
Report Views
- Results display a big picture of payroll analysis based on the earnings periods separated by months
- The report defaults to displaying payroll earned in the last six months. The date range can be changed by entering different to and from dates at the top of the report.
- Refer to the Data Glossary under Get Started on the main BI & Financial Reporting Blink menu for searchable data descriptions and usage rules.
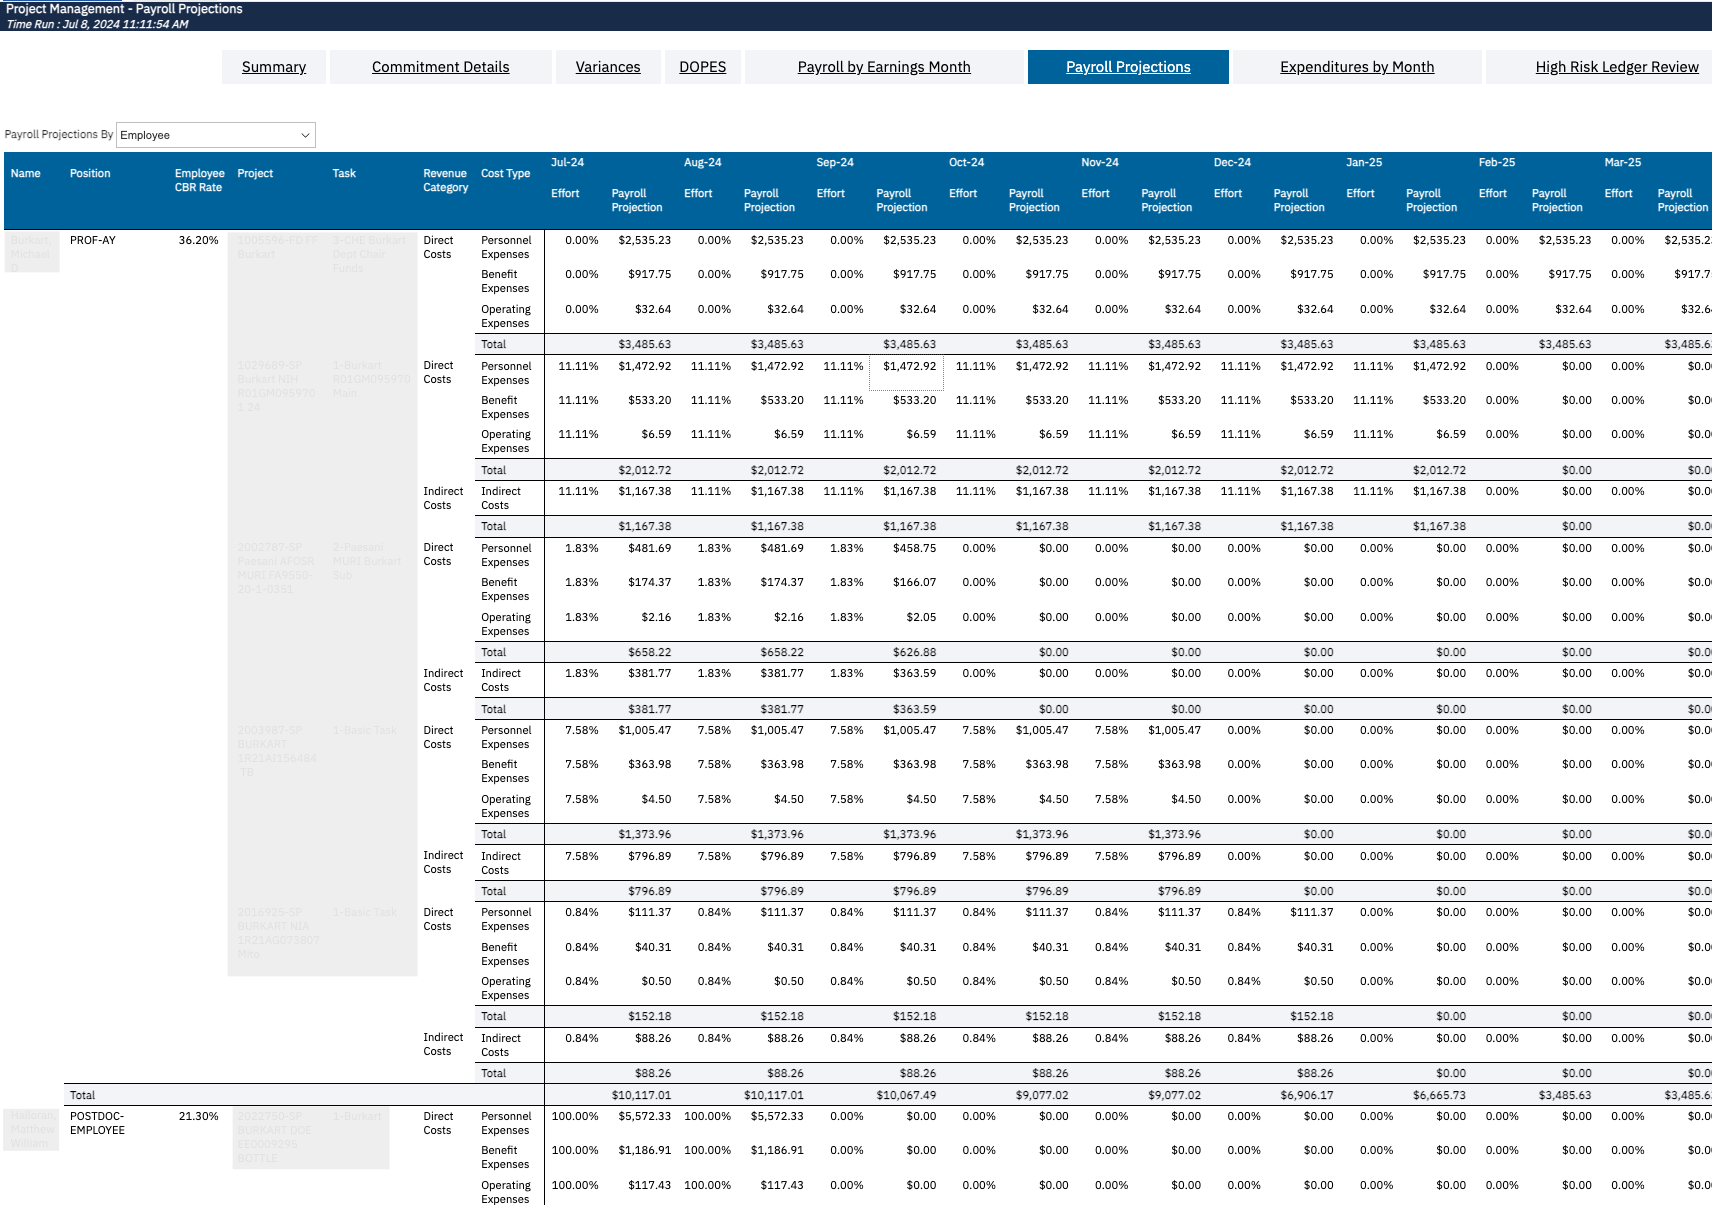
Payroll Projections
Summary
- View payroll projections for the entire portfolio at once
Report Views
- Group by employee to view the full payroll distribution for each employee
- Group by project to see all of the employees paid from a given project
- Refer to the Data Glossary under Get Started on the main BI & Financial Reporting Blink menu for searchable data descriptions and usage rules.
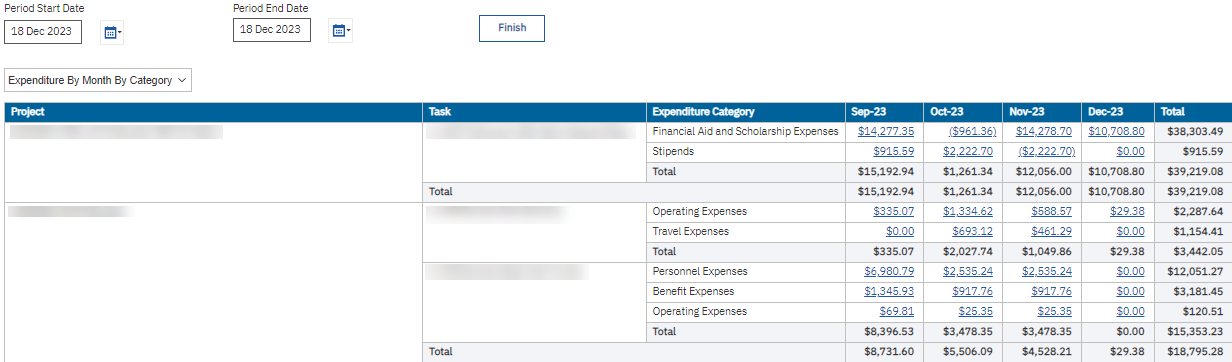
Expenditures by Month
Business Scenarios
- Expenditures by month for all the projects in the portfolio.
Report Views
- The table displays a project's overall expenditures by specific task, expenditure categories, and months.
- The report defaults to displaying expenditures from the last three months. The date range can be changed by entering different to and from dates at the top of the report.
- Click on an amount to view the transactions that make up the amount on the Transaction Details report.
- The report defaults to displaying expenditures by category, but you can also select (using the dropdown) to have them displayed by type in addition to category. That is, in a more granular level.
- Refer to the Data Glossary under Get Started on the main BI & Financial Reporting Blink menu for searchable data descriptions and usage rules.
High Risk Ledger Review
Click on the High-Risk Ledger Review button to view high-risk transactions for the selected portfolio on the Transaction Details report. The report will automatically run for the last closed accounting period. More detailed information can be found in the corresponding drawer of the Transaction Details report blink page.
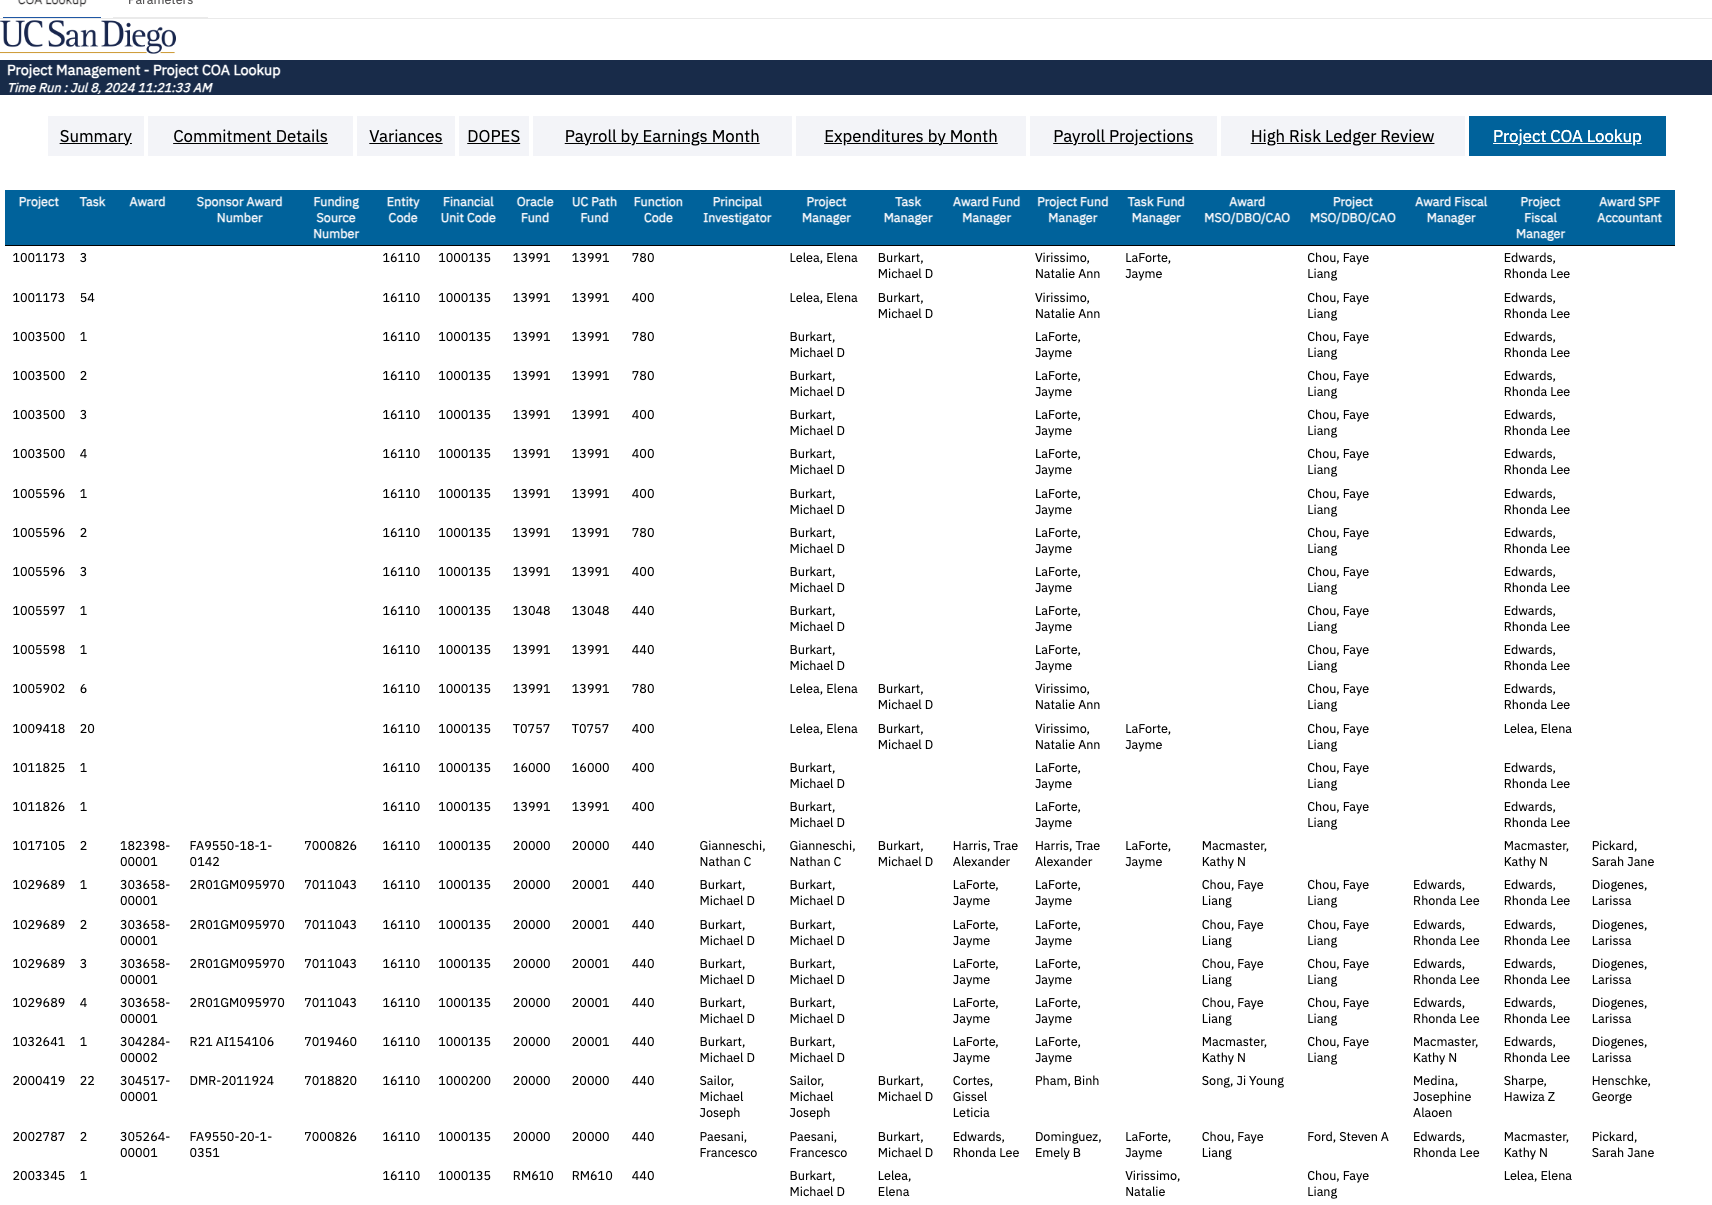
Project COA Lookup
Summary
- This page combines COA and project personnel info, enabling fund managers to obtain this information without leaving the Project Management Dashboard.
Report Views
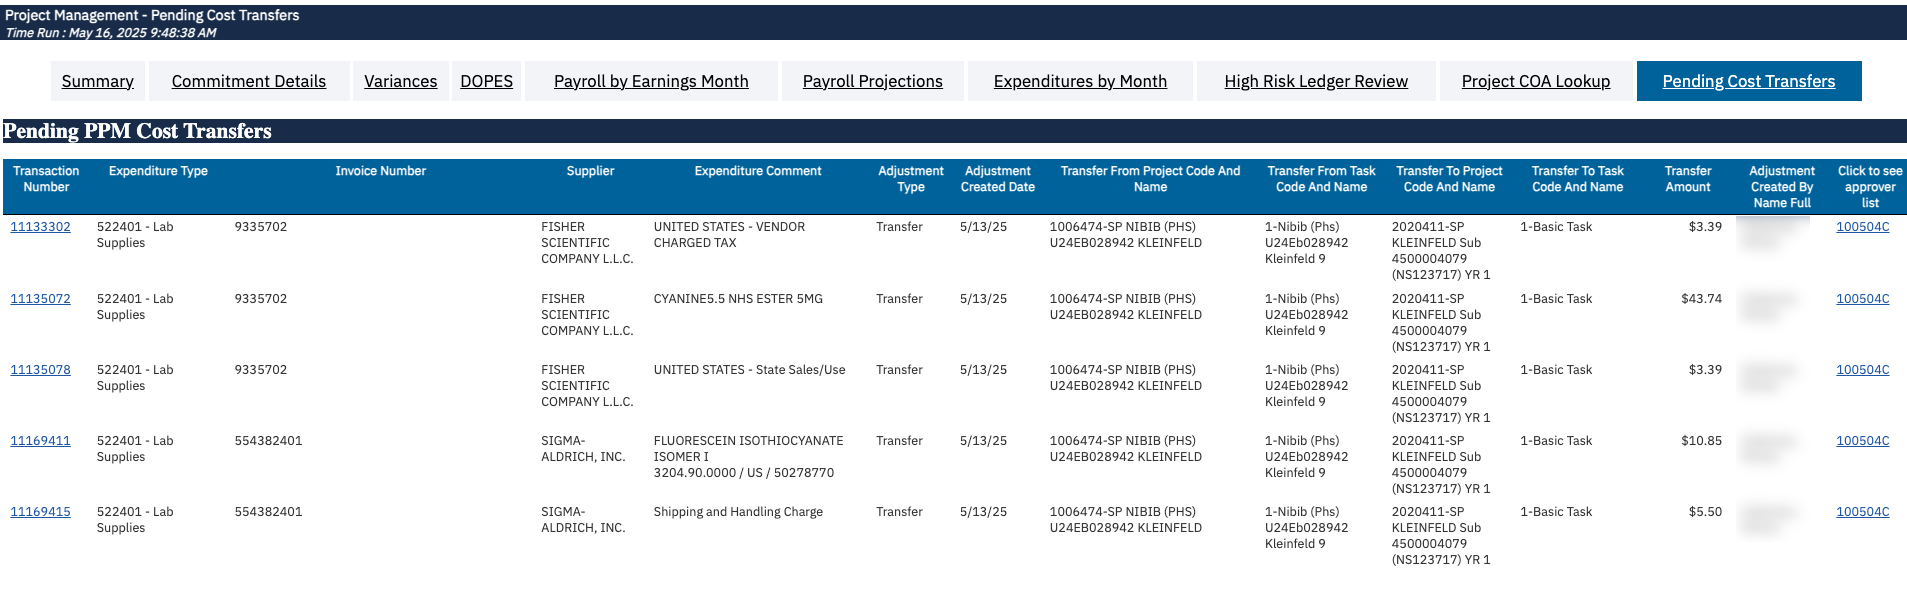
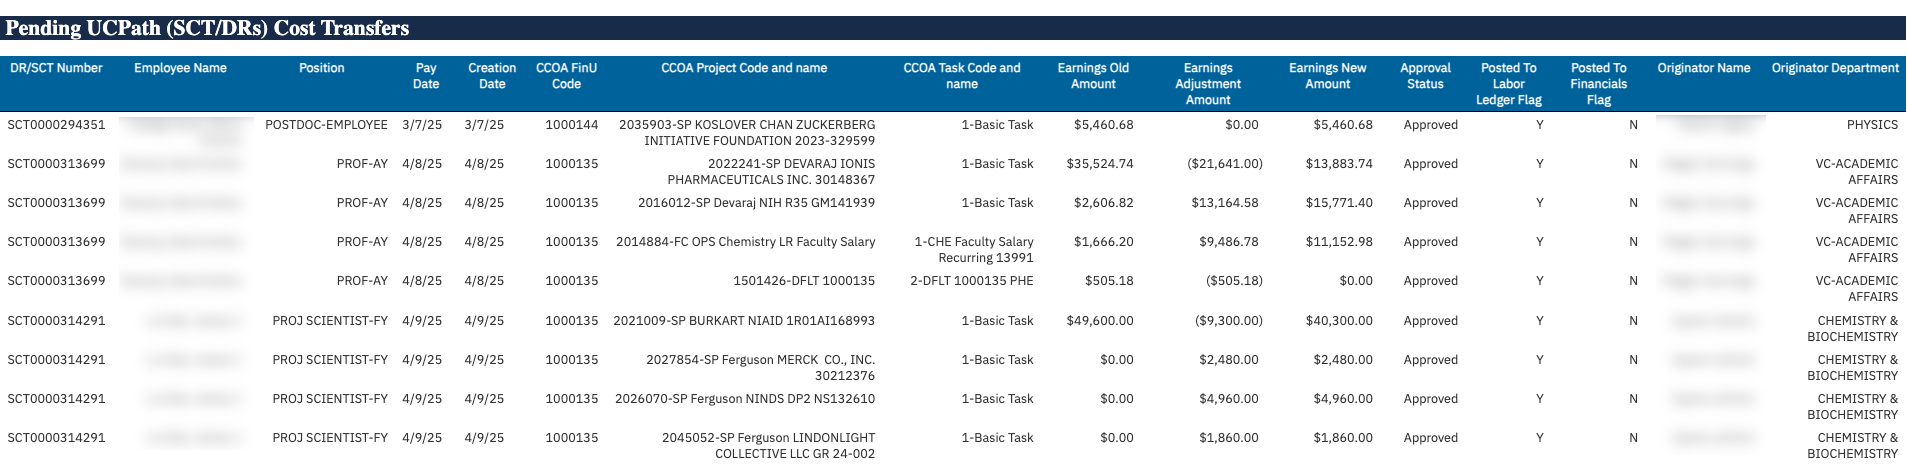
Pending Costs
Summary
This page contains:
- Pending PPM Cost Transfers
- Pending UCPath Cost Transfers, including Direct Retros and Salary Cost Transfers not yet approved, approved but not yet posted to Labor Ledger, and posted to Labor Ledger but not posted to Oracle.
- Click to see approver list to visualize the list of people who can approve the cost transfer.
- Pending P-Card expenses
Report Views

Release Notes & Communications
| Date | Release Notes & Communications |
|---|---|
| 9/9/2025 Budget & Finance Weekly Digest |
New version of the Project Management Dashboard has been released with the enhancements listed below:
|
| 7/15/2025 Budget & Finance Weekly Digest |
Enhancements:
|
| 5/13/2025 Budget & Finance Weekly Digest |
Enhancements:
|
| 1/14/2025 Budget & Finance Weekly Digest | Enhancement: Use the new ‘Quick Prompts’ section to quickly enter a single value for Financial Unit, Project, Project-Task, and/or Fund. Quick Prompts will be added to additional reports in the coming months. |
| 10/15/2024 Budget & Finance Weekly Digest |
|
| 3/12/2024 Budget & Finance Weekly Digest |
|
| 12/12/2023 Budget & Finance Weekly Digest |
Enhancements Release New pages/buttons:
New on-page prompts allow you to adjust settings without returning to the prompt page:
New download option:
Sponsored Projects Summary:
Variances page:
Prompt page redesign Changes were made to modernize and standardize the look and feel of the prompt pages across all financial Cognos reports. Specific changes that were made include:
You can watch a report demo of these enhancements (starting min 36:00) |
| 4/25/2023 Budget & Finance Weekly Digest |
The following enhancements have been made to the Project Management Dashboard:
|