Fixed Assets Dashboard
The Fixed Assets Dashboard provides reports for streamlined fixed asset management, including Asset Inventory, Purchasing, Depreciation, and Retirements and Disposals Reports.
The Fixed Assets Dashboard is available from the Business Analytics Hub (bah.ucsd.edu) under the Financial Management tab.
The dashboard includes:
- Fixed Assets Inventory Report
- Fixed Assets Purchasing Report
- Fixed Assets Depreciation Report
- Fixed Assets Retirements and Disposals Report
Report Demo
You can find the Fixed Assets Report Demo on the Budget & Finance MediaSpace channel - Financial Report Demos playlist.
Access
Access has been provisioned to anyone with standard inquiry and reporting access. Staff who do not have access should complete the Oracle and Concur Role Requests Form. Access failure typically appears as an inability to load prompt values.
- Navigate to bah.ucsd.edu.
- Select Budget & Finance.
- If using the List View, look for Fixed Assets Dashboard in the list or use the search bar at the top right and click the dashboard name
- If using the Card View, click the Financial Management tab and click Launch on the Fixed Assets Dashboard tile
- Use your Active Directory credentials to sign in, if prompted.
Fixed Assets Inventory Report
Summary
The Asset Inventory Report allows you to access general asset information like custodian, physical location, and other asset details. Utilize this report for the following purposes:
- Identify all assets held by a certain department, custodian or within a certain building.
- Track custodial responsibility for assets.
- Identify the value and useful life of assets.
- Manage summarized assets based on specific departments.
Data Selection and View Options
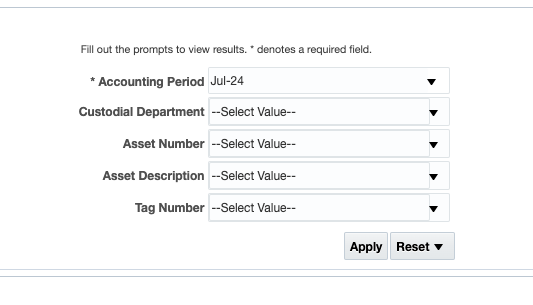
- Use these parameters to filter for the data you want to view
- These filters can be used in combination or individually to produce desired results
Report View
- Results display in a default table with the ability to export the result set into a file.
- Refer to the Data Glossary under Get Started on the main BI & Financial Reporting Blink menu for searchable data descriptions and usage rules.
Fixed Assets Purchasing Report
Summary
The Asset Purchasing report provides a comprehensive view of assets and their associated Invoices/POs. Use this report for:
- Reviewing purchase-related details such as invoices and purchase orders linked to assets.
- Gaining insights into the purchasing history of assets.
- Tracking costs and expenditures related to specific assets, aiding financial analysis and budget allocation for acquisitions.
Data Selection and View Options
- Use these parameters to filter for the data you want to view
- These filters can be used in combination or individually to produce desired results
Report View
- Results display in a default table with the ability to export the result set into a file
- Additional columns are available for users to add to the report
- Refer to the Data Glossary under Get Started on the main BI & Financial Reporting Blink menu for searchable data descriptions and usage rules
Fixed Assets Depreciation Report
Summary
The Asset Depreciation Report offers insights into accounting information about asset values post-depreciation. Use this report for:
- Track monthly depreciation calculations to understand asset value changes.
- Evaluate accumulated depreciation and net book values for financial assessment.
- Determine asset useful life and remaining life for effective financial planning, forecasting, and compliance with accounting standards.
Data Selection and View Options
- Users can choose specific accounting periods and search criteria to view depreciation details.
- Use these parameters to filter for the data you want to view
- These filters can be used in combination or individually to produce desired results
Report View
- Results display in a default table with the ability to export the result set into a file
- Additional columns are available for users to add to the report
- Refer to the Data Glossary under Get Started on the main BI & Financial Reporting Blink menu for searchable data descriptions and usage rules
Fixed Assets Retirements and Disposals Report
Summary
The Asset Retirements and Disposals report is used to view retired and disposed assets. Use this report for:
- Managing the retirement or disposal process of assets.
- Tracking retirement dates and reasons for decommissioning.
- Assessing the financial impact of retired assets through cost and net book value details.
Data Selection and View Options
- Use these parameters to filter for the data you want to view
- These filters can be used in combination or individually to produce desired results
Report View
- Results display in a default table with the ability to export the result set into a file
- Additional columns are available for users to add to the report
- Refer to the Data Glossary under Get Started on the main BI & Financial Reporting Blink menu for searchable data descriptions and usage rules
Release Notes & Communications
| Date | Release Notes & Communications |
|---|---|
| 10/15/2024 Budget & Finance Weekly Digest |
|
| 1/16/2024 Budget & Finance Weekly Digest | Enhancements:
|
| 10/17/2023 Budget & Finance Weekly Digest |
The Fixed Assets Dashboard is a comprehensive tool that offers a range of reports with information from the new Fixed Assets Module. This dashboard includes:
|

