Department Operations Dashboard
This Dashboard provides Year-To-Date overall net financial surplus or loss by Managerial Fund categories, Mission, or Project Classification.
The Department Operations Dashboard is available from the Business Analytics Hub (bah.ucsd.edu) under the Financial Management tab.
Report Demo
You can find the Department Operations Dashboard Demo on the Budget & Finance MediaSpace channel - Financial Reports Demos playlist.
Access
- Navigate to bah.ucsd.edu.
- Select Budget & Finance.
- If using the List View, look for Department Operations Dashboard in the list or use the search bar at the top right and click the dashboard name
- If using the Card View, click the Financial Management tab and click Launch on the Department Operations Dashboard tile
- Use your Active Directory credentials to sign in, if prompted.
Navigation
The Cognos and Oracle Tips & Tricks page shares various recommendations on navigating report functionality
- Use these parameters to filter for the data you want to view
- These filters can be used in combination or individually to produce desired results
Additional Information:
- Fiscal Year and Accounting Period are required prompts
- Financial Unit prompts
- These are cascading prompts so selection in one area will filter the options available
- Single Select for Level 2 (VC Area) and Level 3 (School). To remove your selection, hold CTRL and click
- Multi Select for Level 4 (Department) or Financial Unit. To remove your selection, click “Deselect all”
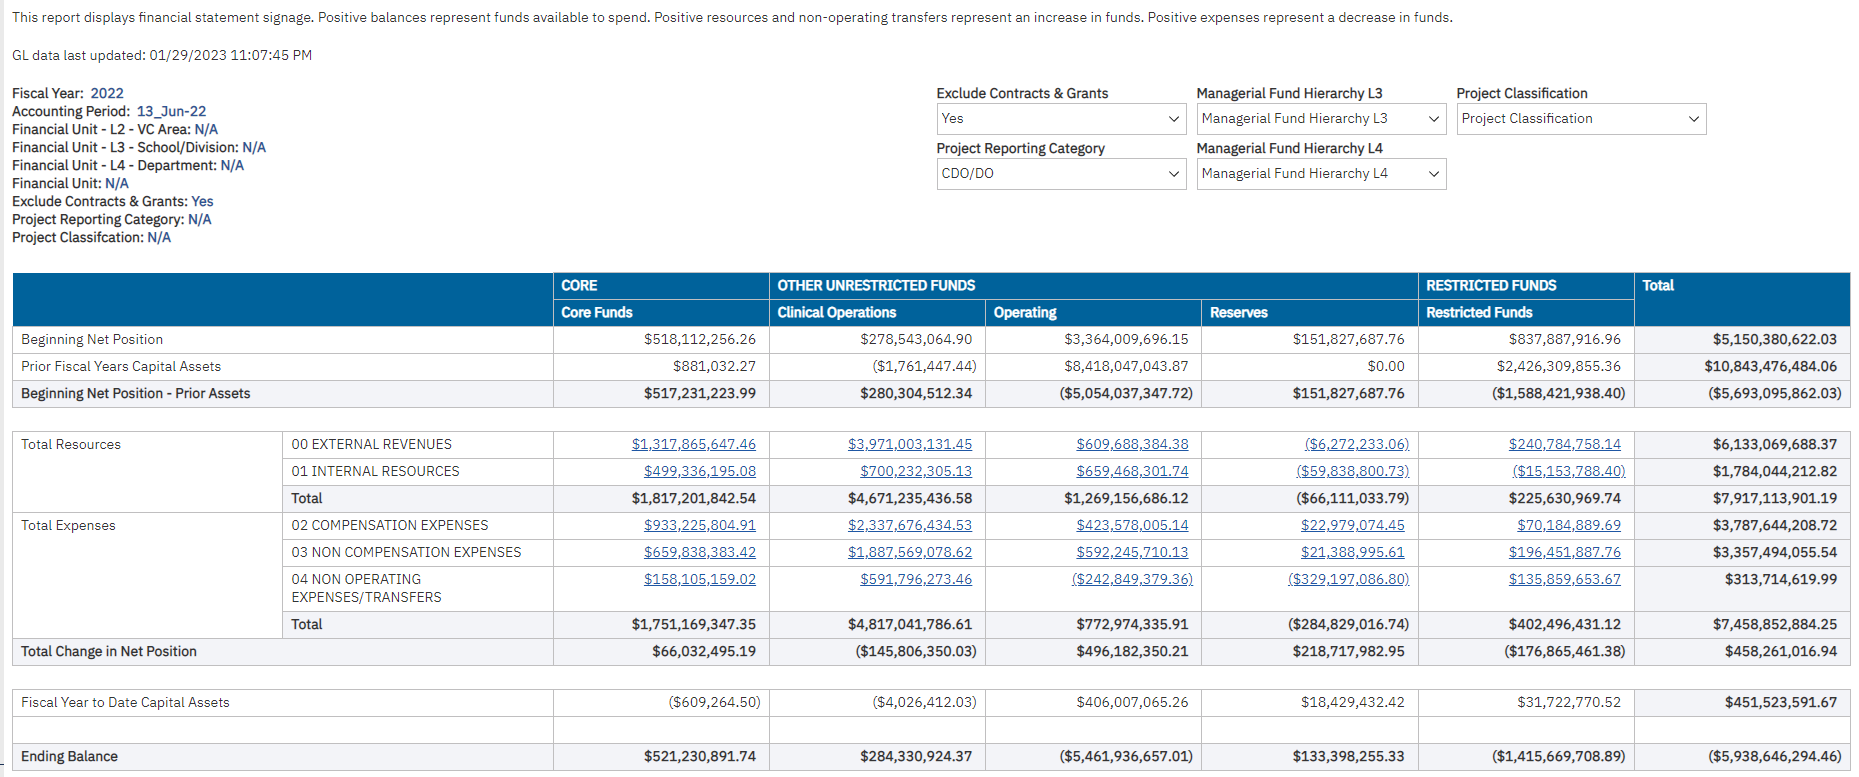
- This Dashboard displays financial statement signage. Positive balances represent funds available to spend. Positive resources and non-operating transfers represent an increase in funds. Positive expenses represent a decrease in funds.
- This Dashboard includes values for Project 0000000 – No Project. It will be classified as No Reporting Category-NRC. Default Projects are also classified as No Reporting Category-NRC.
- Until such time as revenue for Contracts and Grants can be captured at the Project level, all Contract and Grant revenue can be found in Project 0000000 – No Project.
- All pages have on-page prompts that allow the user to include or exclude data without having to go back to the prompt page. All on-page prompts affect the data displayed in all tabs. For example, if you select “Yes” on the “Exclude Contracts & Grants” prompt on the page, all tabs will then exclude “Contracts & Grants”
- A link in the upper right corner “Raw Data Download Here” allows users to download all data into an .xlsx file only utilizing the Accounting Period and Financial Unit prompts. Any on page prompts will not alter the data in the download.
- Use the Last Closed or Open Accounting Period prompt to schedule this report for monthly delivery. More information on how to schedule Cognos reports can be found here.
Dept Ops
- Results display in a table with Managerial Fund hierarchy across the top by Managerial Account Hierarchy on the far left
- Amounts can be clicked on to provide a Fiscal Year to Date Ending Signed Balance by FinU, Project, Fund and Account. Balances can be further drilled through to the Transaction Details report.
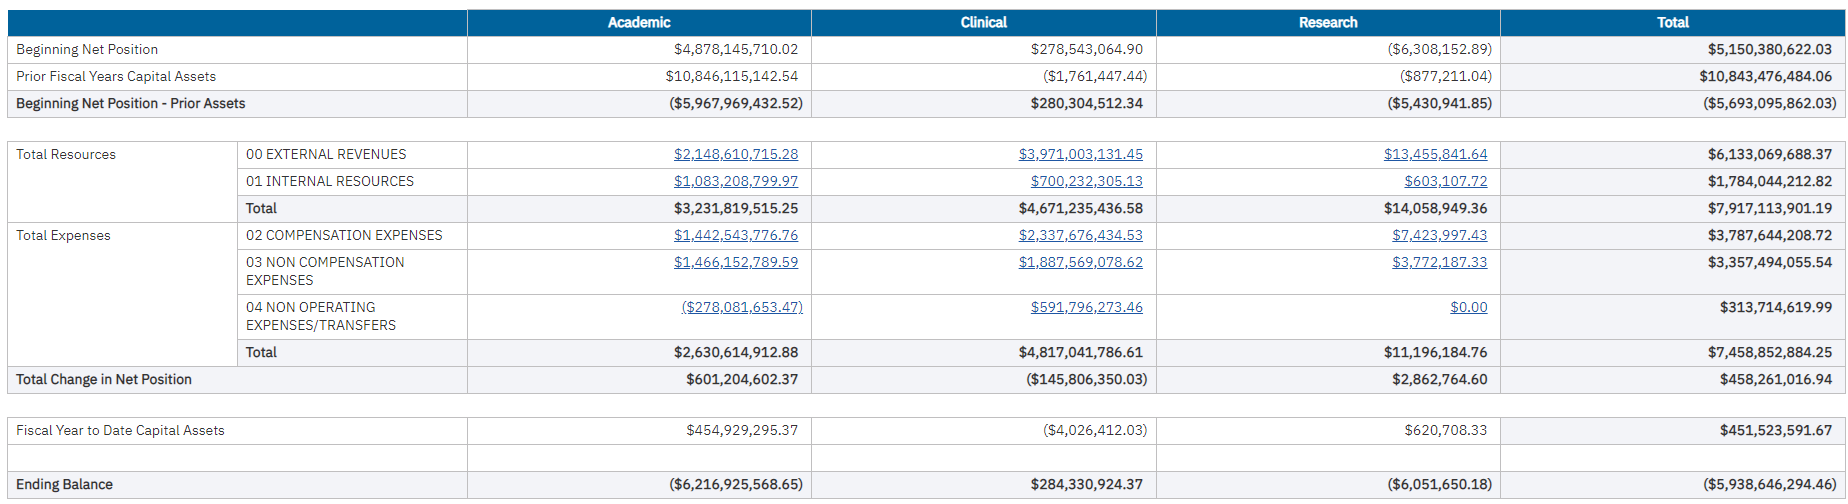
Missions
- The missions of UC San Diego are broken out using custom logic based on the fund, which groups them into Academic, Clinical, or Research.
- The Research mission includes Contracts and Grants, Specified State Appropriations, as well as specific funds 18127, 19954, 19956, 19968, and 19981.
- This enables specified research balances that are the Core or Operating Managerial Fund Hierarchy to be grouped into Research. For example, recipients of California Conservation Genomics Project, Tobacco Related Disease Research, or AIDS Research funds are found in the Managerial Fund Hierarchy in Core or Operating, but on the Missions tab, these balances would be grouped under Research.
- Amounts can be clicked on to provide a Fiscal Year to Date Ending Signed Balance by FinU, Project, Fund and Account. Balances can be further drilled through to the Transaction Details report.
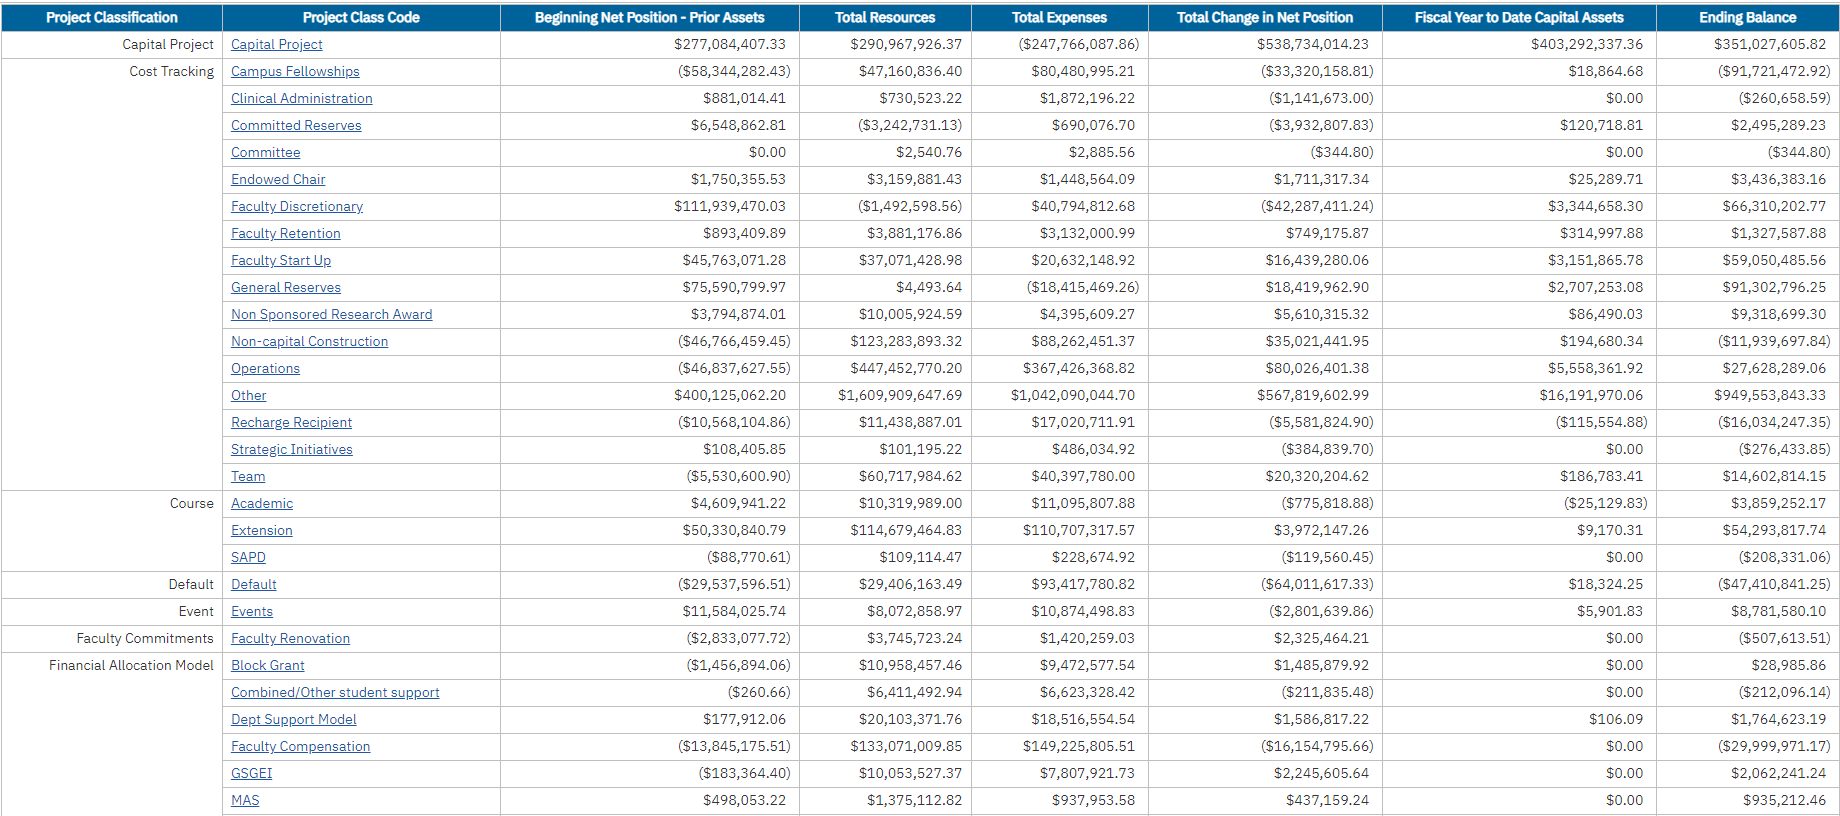
Project Classification
- Provides ending balance by groups of projects according to their classification.
- The project classifications can be clicked on to then drill to the GL Project Balances report that displays the balances and any projections by project.
Release Notes & Communications
| Date | Release Notes & Communications |
|---|---|
| 1/14/2025 Budget & Finance Weekly Digest |
Enhancement: A prompt for Last Closed or Open Accounting Period has been added to enable users to schedule reports for automatic monthly delivery. Follow this KBA on how to schedule Cognos reports for monthly delivery. |
| 10/15/2024 Budget & Finance Weekly Digest |
Project Nickname has been added to the raw data download. |
| 12/12/2023 Budget & Finance Weekly Digest |
Changes were made to modernize and standardize the look and feel of the prompt pages across all financial Cognos reports. Specific changes that were made include:
|
| 01/31/2023 Budget & Finance Weekly Digest |
The new Department Operations Dashboard provides year-to-date overall net financial surplus or loss by Managerial Fund categories, Mission, or Project Classification. It is intended to help department fiscal managers, MSOs, DBOs, and Assistant Deans understand the health of their operations. The dashboard is accessible from the Business Analytics Hub under the Budget and Financial Management tab. For more information about the dashboard, visit the Department Operations Dashboard Blink page and join the Fund Management office hours this week to see a demo. |