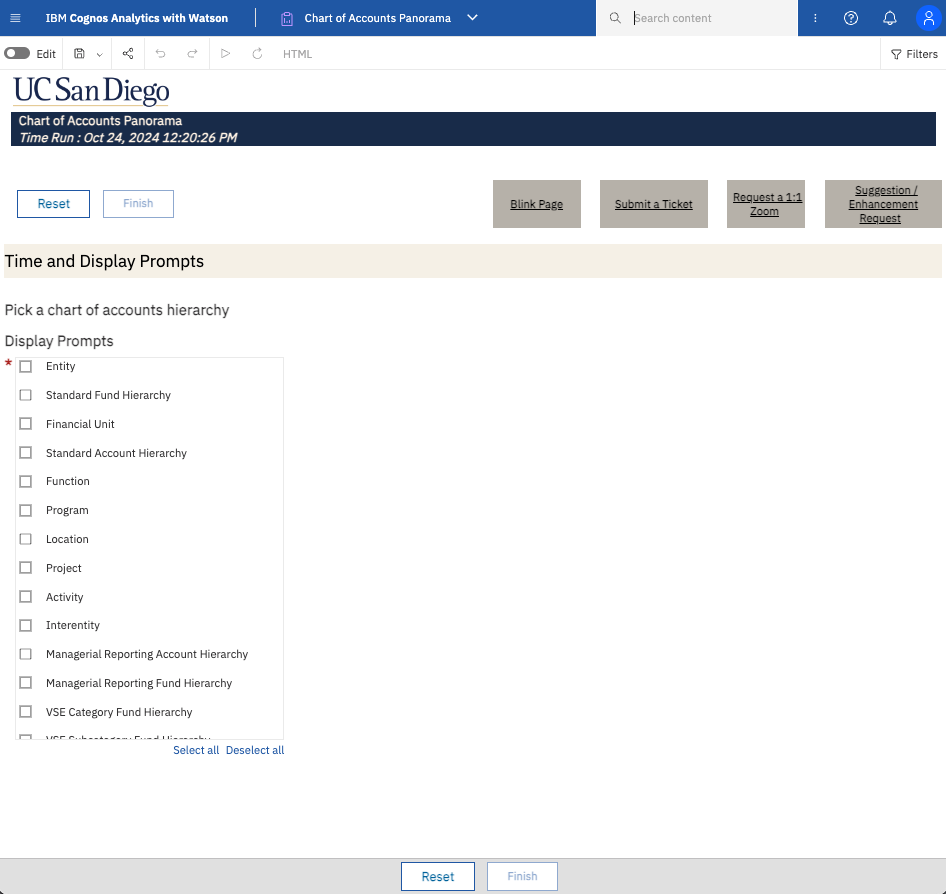
Chart of Accounts Panorama
Hierarchies help define structure, and provide for standard and consistent financial reporting to our various stakeholders about UC San Diego’s financial performance and financial position over a specified period of time. The Chart of Accounts Panorama is designed to help you explore the UCSD Chart of Accounts and hierarchies.
The Chart of Accounts Panorama is available from the Business Analytics Hub (bah.ucsd.edu) under the Information Lookups tab.
The dashboard includes:
- Entity
- Standard Fund Hierarchy
- FinU (Financial Unit)
- Standard Account Hierarchy
- Function
- Program
- Location
- Project
- Activity
- Interentity
- Managerial Reporting Account Hierarchy
- Managerial Reporting Fund Hierarchy
- VSE Category Fund Hierarchy
- VSE Subcategory Fund Hierarchy
Access
Access has been provisioned to anyone with the Oracle BI Consumer JR role. Staff who do not have access should request the Oracle role. Access failure appears as error "Unable to load requested view. Displaying home view instead."
- Navigate to bah.ucsd.edu.
- Select Budget & Finance.
- If using the List View, look for Chart of Accounts Panorama in the list or use the search bar at the top right and click the dashboard name
- If using the Card View, click the Information Lookups tab and click Launch on the Chart of Accounts Panorama tile
- Use your Active Directory credentials to sign in, if prompted.
Navigation
The Cognos and Oracle Tips & Tricks page shares various recommendations on navigating report functionality
- Use these parameters to filter for the data you want to view
- These filters can be used in combination or individually to produce desired results
- Select the hierarchies you want to see on the reports before running it. After running the report, you can filter for each hierarchy by navigating to its different pages.
Entity
Data Selection and View Options
- There's no prompt page for this report.
Report Views
- Results display in a table of 8 columns representing the entity categories in hierarchical order from left to right
- Refer to the Data Glossary under Get Started on the main BI & Financial Reporting Blink menu for searchable data descriptions and usage rules
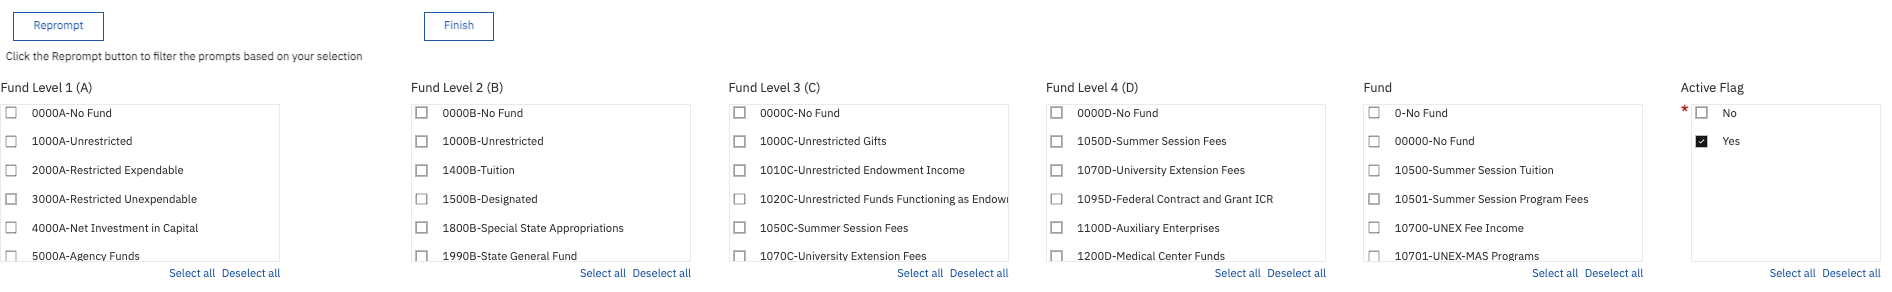
Standard Fund Hierarchy
Data Selection and View Options
- The report is designed to show the full hierarchy
- To further refine the results use the available parameters to search the Fund
Report Views
- The results display in a table of 10 Columns representing the fund categories in hierarchical order from left to right
- Refer to the Data Glossary under Get Started on the main BI & Financial Reporting Blink menu for searchable data descriptions and usage rules

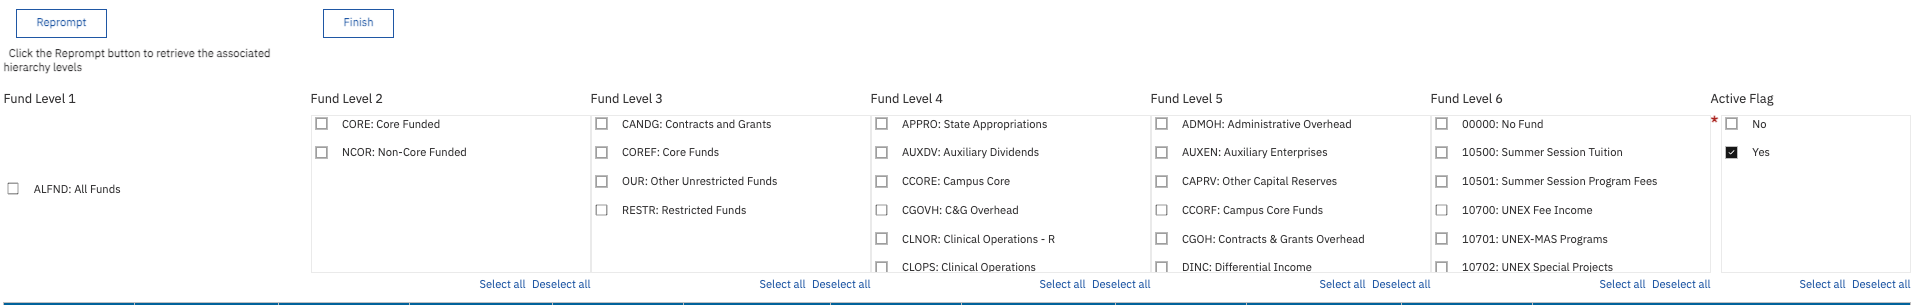
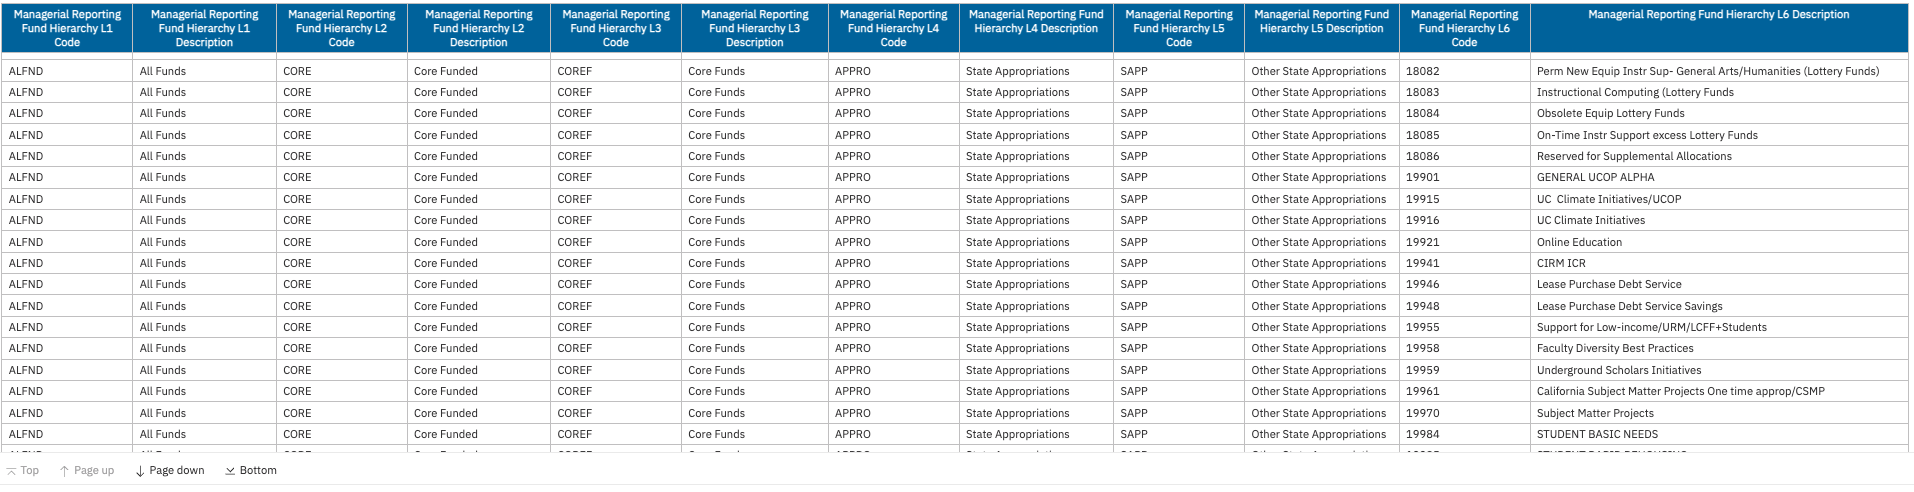
Managerial Reporting Fund Hierarchy
Business Scenarios
-
The Managerial Reporting Fund Hierarchy categorizes funds in fund groupings used in many UC San Diego internal financial management reports
- The Managerial Reporting Fund Hierarchy is an essential component for campus resource allocations, such as the Core funded portion of the campus budget
- The Managerial Reporting Fund Hierarchy reports the hierarchy structure for each fund and which funds are included at each level of the hierarchy
Data Selection and View Options
- The report is designed to show the full hierarchy
- To further refine the results use the available parameters to search the Fund
Report Views
- Results display in a table with a single section of 12 columns representing the fund categories in hierarchical order from left to right
- Refer to the Data Glossary under Get Started on the main BI & Financial Reporting Blink menu for searchable data descriptions and usage rules
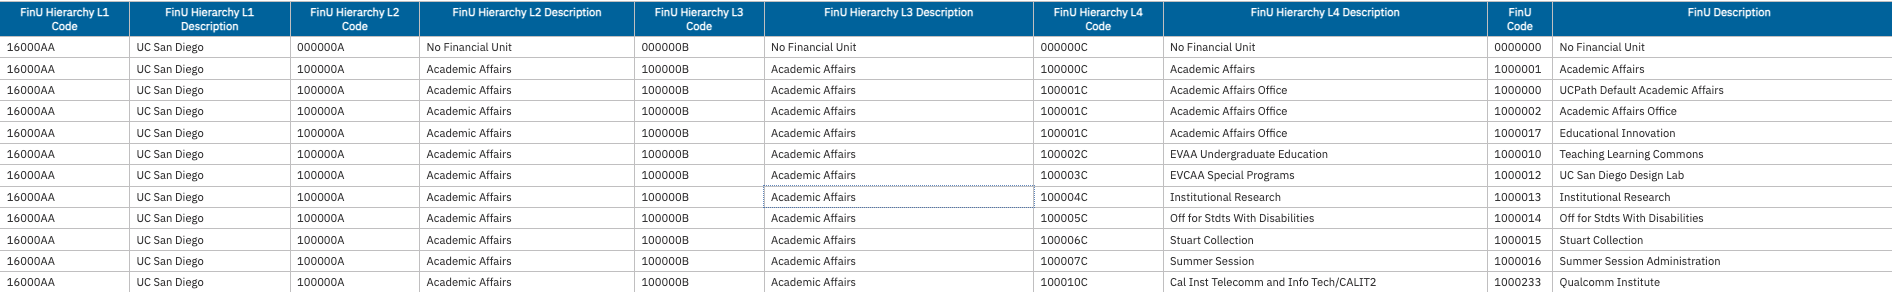
FinU (Financial Unit)
Data Selection and View Options
- The report is designed to show the full hierarchy
- To further refine the results use the available parameters to search the FinU
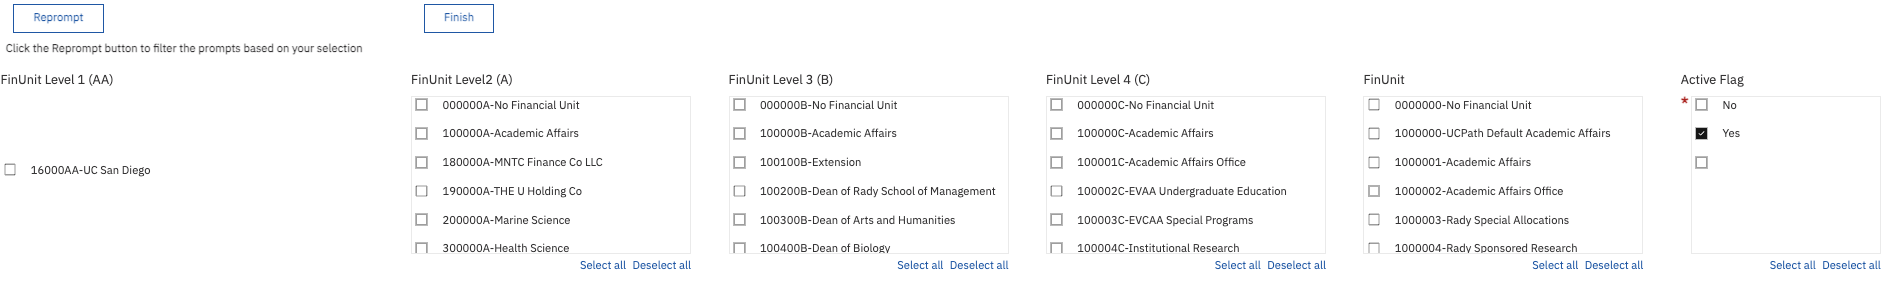
Report Views
- Results display in a table with a single section of 10 columns representing the FinU categories in hierarchical order from left to right
- Refer to the Data Glossary under Get Started on the main BI & Financial Reporting Blink menu for searchable data descriptions and usage rules
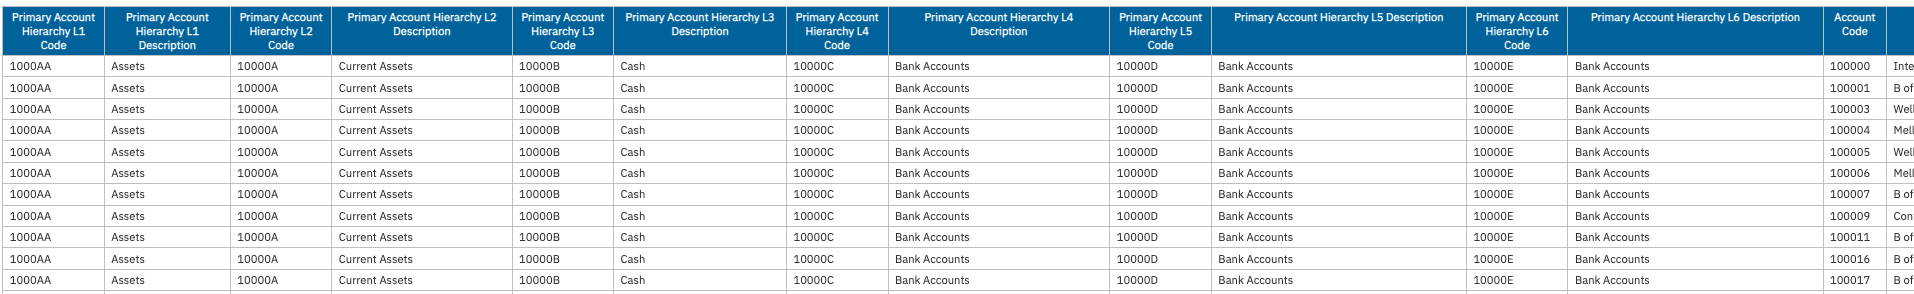
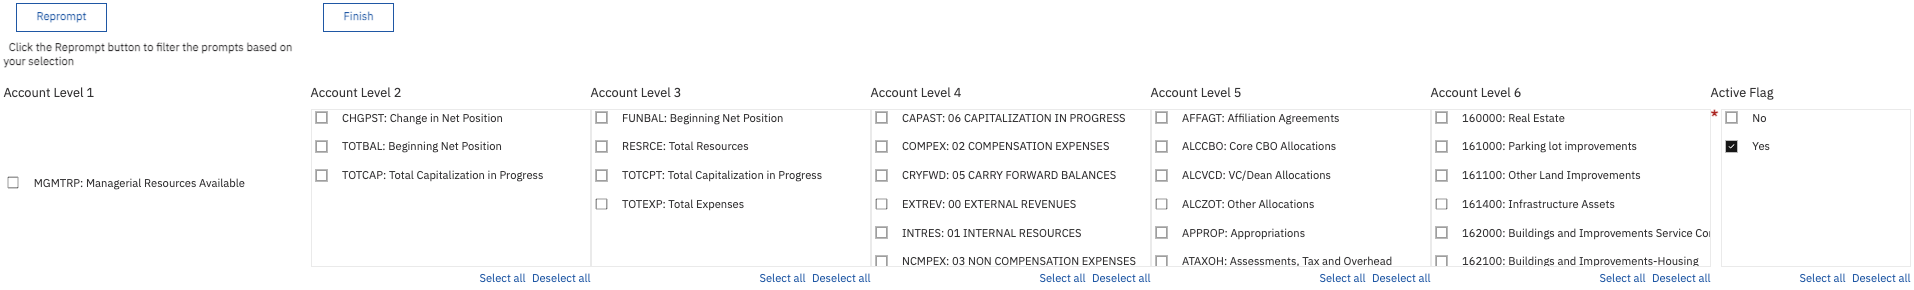
Standard Account Hierarchy
Data Selection and View Options
- The report is designed to show the full hierarchy
- To further refine the results use the available parameters to search the Account
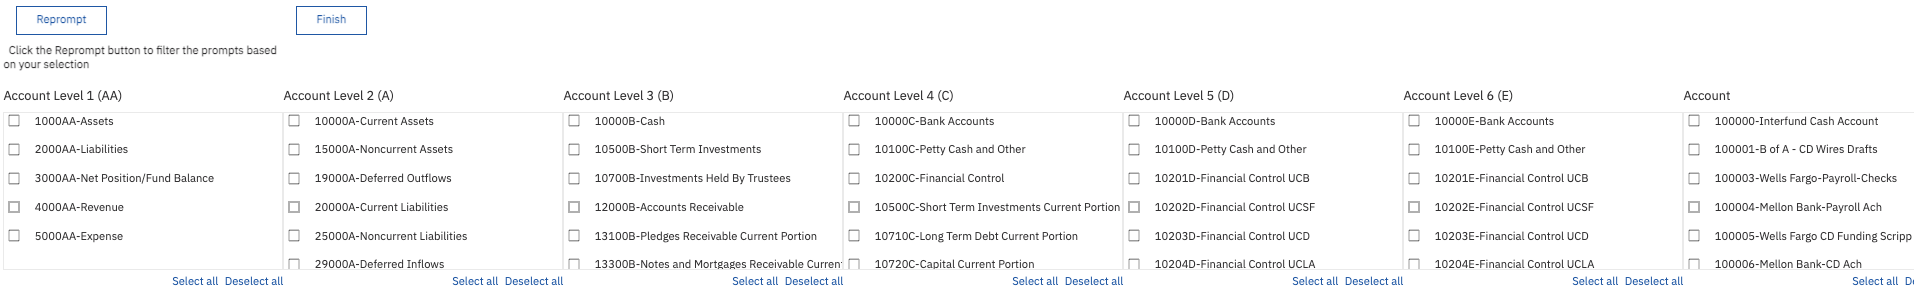
Report Views
- Results display in a table with a single section of 14 columns representing the Account categories in hierarchical order from left to right
- Refer to the Data Glossary under Get Started on the main BI & Financial Reporting Blink menu for searchable data descriptions and usage rules
Managerial Reporting Account Hierarchy
Business Scenarios
-
The Managerial Reporting Account Hierarchy categorizes accounts into account groupings used in many UC San Diego internal financial management reports.
- The Managerial Reporting Account Hierarchy is an essential component for reporting financial performance as it groups accounts into Resources, Expenses, Net Surplus/Deficit, and Total Balance which facilitates financial planning, analysis, benchmarking and decision making.
- The Managerial Reporting Account Hierarchy reports the hierarchy structure for each account and which accounts are included at each level of the hierarchy
Data Selection and View Options
- The report is designed to show the full hierarchy
- To further refine the results use the available parameters to search the Account hierarchy
Report Views
- Results display in a table with a single section of 10 columns representing the Account categories in hierarchical order from left to right
- Refer to the Data Glossary under Get Started on the main BI & Financial Reporting Blink menu for searchable data descriptions and usage rules

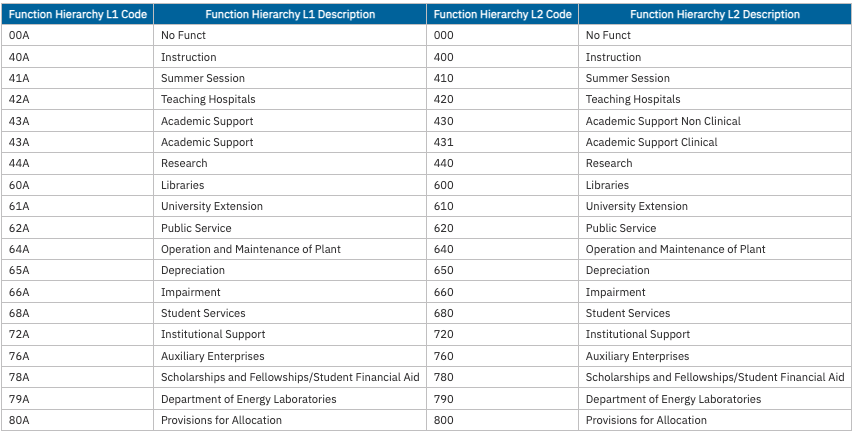
Function
Data Selection and View Options
- The report is designed to show the full hierarchy
- To further refine the results use the available parameters to search the Function
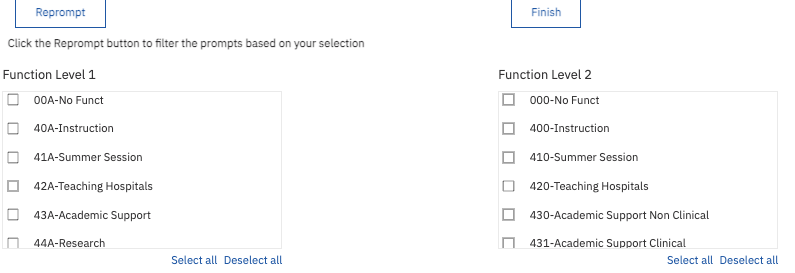
Report Views
- Results display in a table with a single section of 4 columns representing the Function categories in hierarchical order from left to right
- Refer to the Data Glossary under Get Started on the main BI & Financial Reporting Blink menu for searchable data descriptions and usage rules
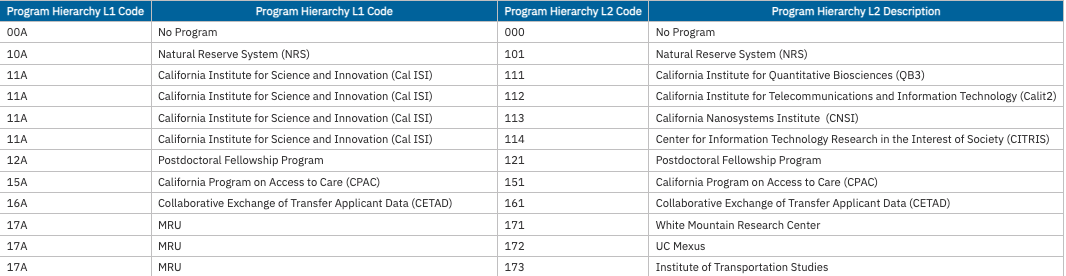
Program
Data Selection and View Options
- The report is designed to show the full hierarchy
- To further refine the results use the available parameters to search the Program
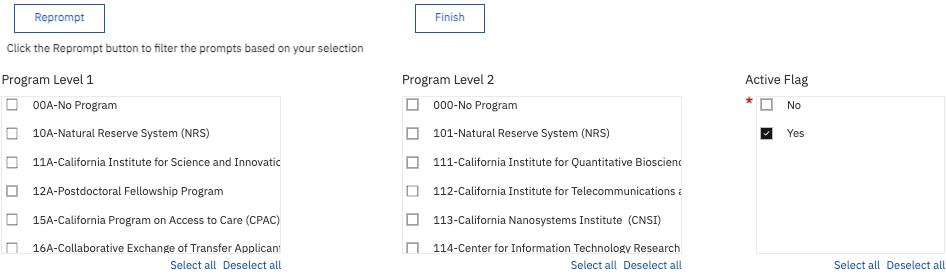
Report Views
- Results display in a table with a single section of 4 columns representing the Program categories in hierarchical order from left to right
- Refer to the Data Glossary under Get Started on the main BI & Financial Reporting Blink menu for searchable data descriptions and usage rules
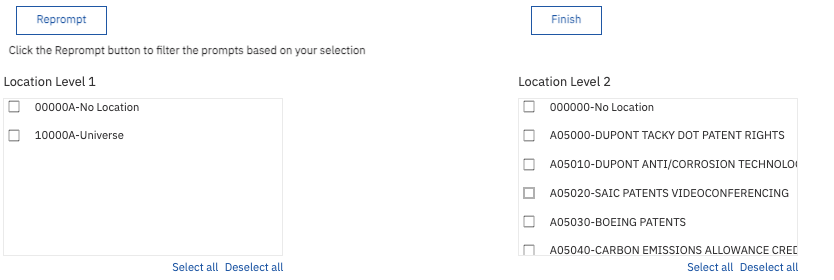
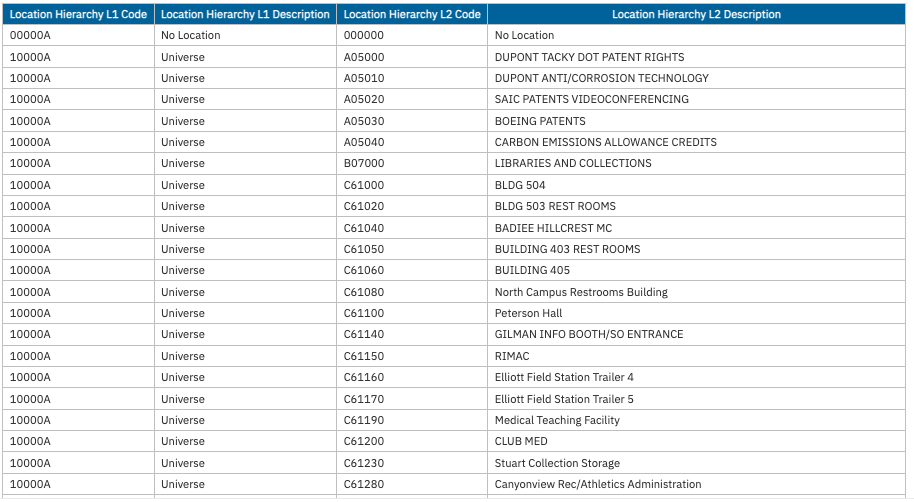
Location
Data Selection and View Options
- The report is designed to show the full hierarchy
- To further refine the results use the available parameters to search the Location
Report Views
- Results display in a table with a single section of 4 columns representing the Location categories in hierarchical order from left to right
- Refer to the Data Glossary under Get Started on the main BI & Financial Reporting Blink menu for searchable data descriptions and usage rules
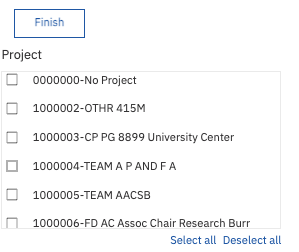
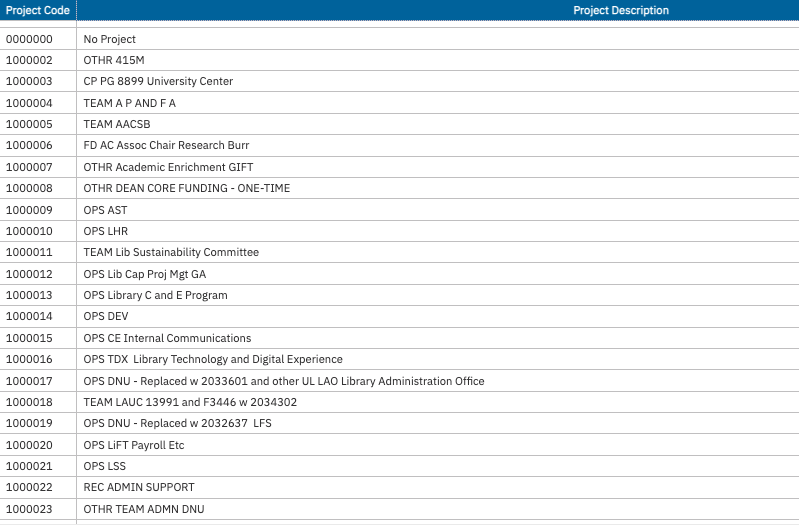
Project
Data Selection and View Options
- The report is designed to show the full hierarchy
- To further refine the results use the available parameters to search the Project
Report Views
- Results display in a table with a single section of 4 columns representing the Project categories in hierarchical order from left to right
- Refer to the Data Glossary under Get Started on the main BI & Financial Reporting Blink menu for searchable data descriptions and usage rules
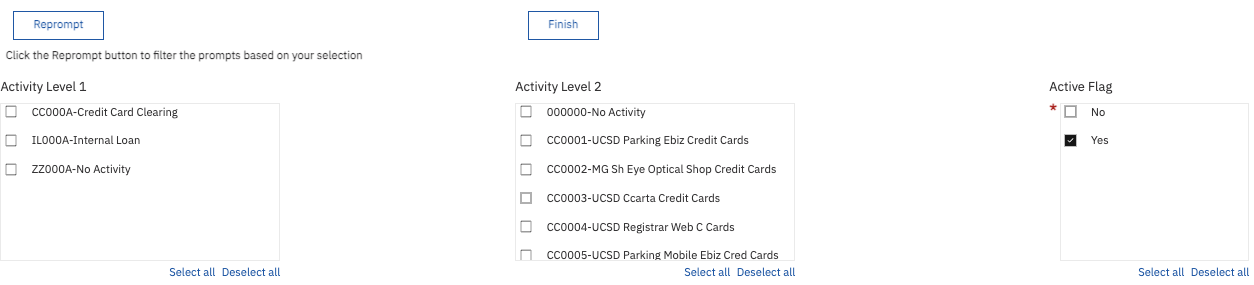
Activity
Data Selection and View Options
- The report is designed to show the full hierarchy
- To further refine the results use the available parameters to search the Activity
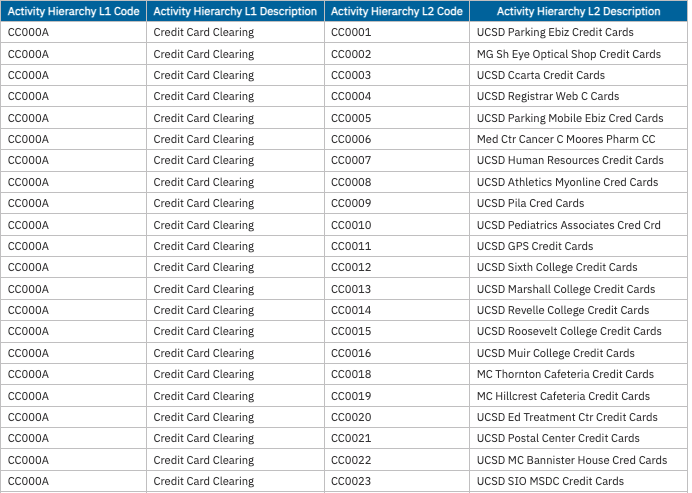
Report Views
- Results display in a table with a single section of 4 columns representing the Activity categories in hierarchical order from left to right
- Refer to the Data Glossary under Get Started on the main BI & Financial Reporting Blink menu for searchable data descriptions and usage rules
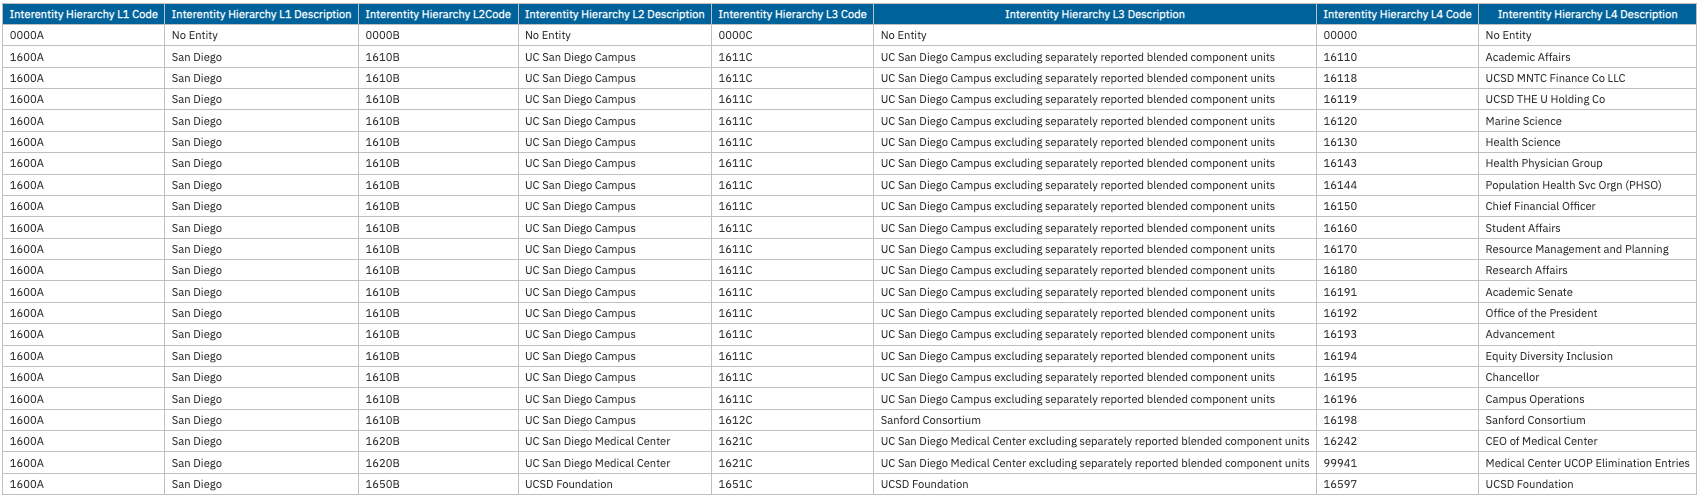
Interentity
Data Selection and View Options
- The report is designed to show the full hierarchy
- To further refine the results use the available parameters to search the Interentity
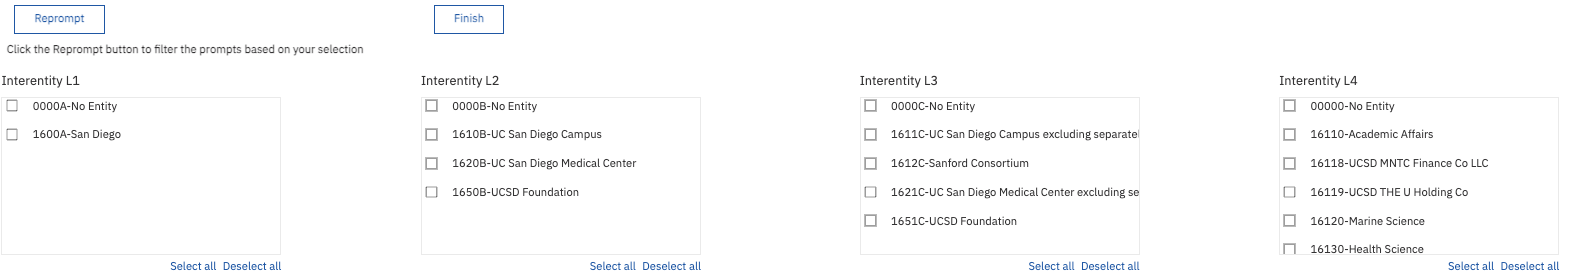
Report Views
- Results display in a table with a single section of 4 columns representing the Interentity categories in hierarchical order from left to right
- Refer to the Data Glossary under Get Started on the main BI & Financial Reporting Blink menu for searchable data descriptions and usage rules
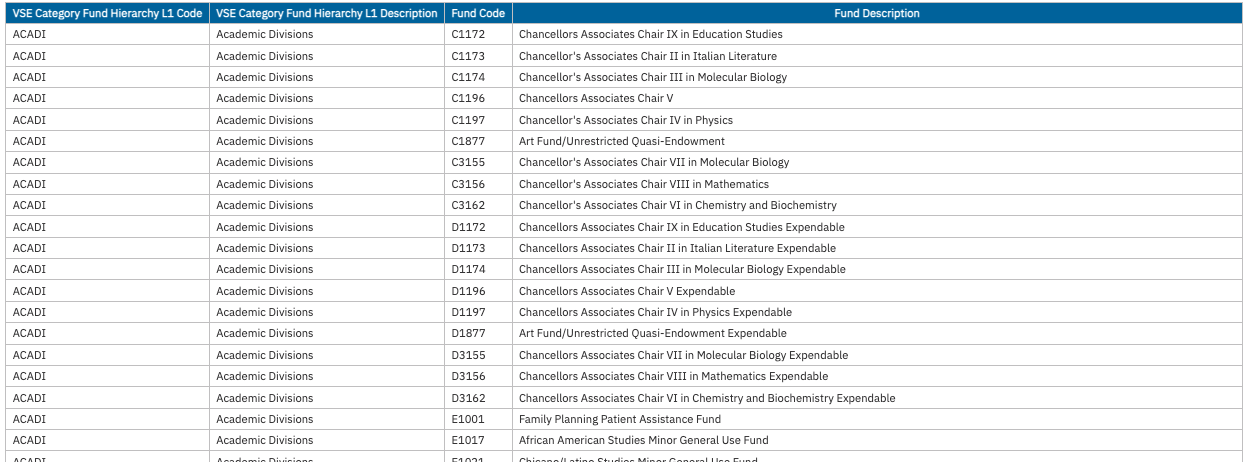
VSE Category
Business Scenarios
VSE Category is the broadest classification of a gift fund purpose. This would typically be used for broad searches such as “Student Financial Aid” to the organization or a specific Financial Unit. The coding is driven by rules from the Council for Advancement and Support of Education (CASE) and is used internally by Advancement to complete the annual Voluntary Support of Education (VSE) Survey and other UCOP surveys. This annual survey collects data on philanthropic support within higher education institutions in the United States.
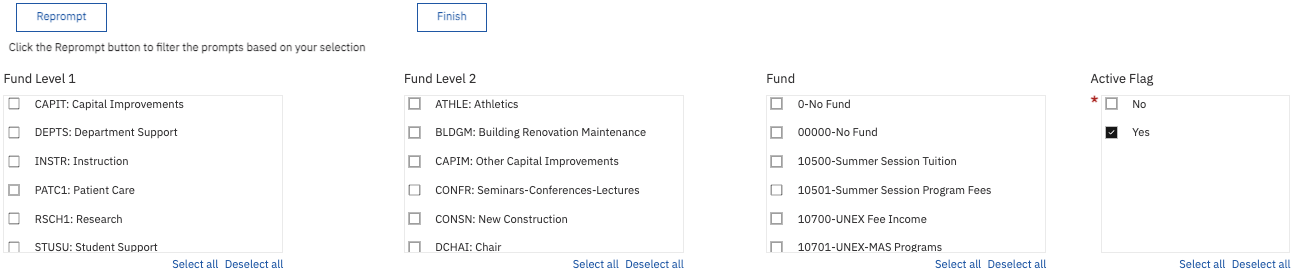
Data Selection and View Options
The report is designed to show the full hierarchy. To further refine the results, use the available parameters.
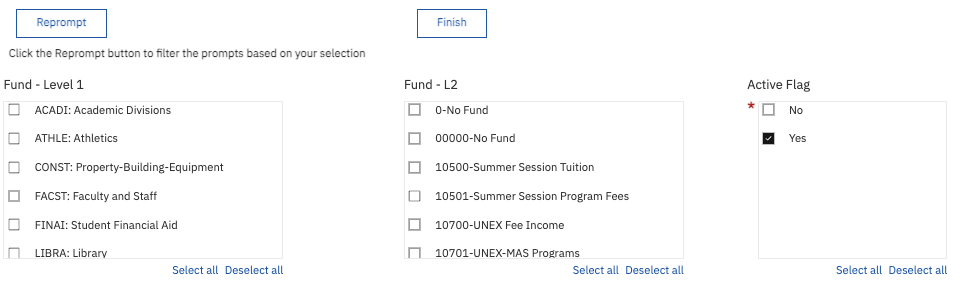
Report Views
Results display in a table with a single section of 4 columns representing the VSE categories in hierarchical order from left to right.
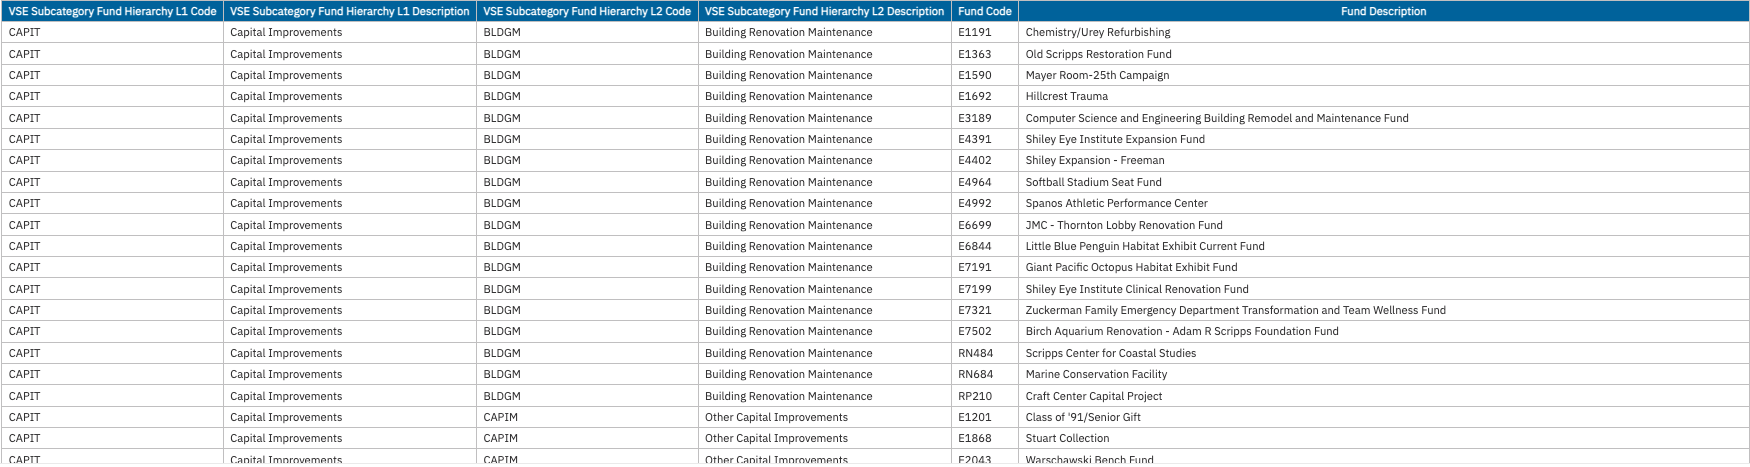
VSE Subcategory
Business Scenarios
VSE Subcategory has two levels that further define a broad gift fund purpose. Specific fund purpose information can be found in STAR. This would typically be used for searches such as all “Department Support” or all “Endowed Chairs” across the organization or a specific Financial Unit. These categories are defined by the Council for Advancement and Support of Education (CASE), UCOP, and UC San Diego.
Data Selection and View Options
The report is designed to show the full hierarchy. To further refine the results, use the available parameters.
Report Views
Results display in a table with a single section of 6 columns representing the VSE categories in hierarchical order from left to right.
Release Notes
| Date | Release Notes & Communications |
|---|---|
| 10/29/2024 Budget & Finance Weekly Digest |
This dashboard (previously in Oracle) has been rebuilt in Cognos to allow for the addition of an Active Flag for each chart element. The report defaults to only displaying values that are currently active. |
| 7/11/2023 Budget & Finance Weekly Digest |
Like the Gift Funds Panorama, the Chart of Accounts Panorama has also been enhanced to include the entire hierarchies for VSE Category and VSE Subcategory so that you can review how all gift funds are categorized. |