UCSDPLAN Compensation Inflation Details Report
The UCSDPLAN Compensation Inflation Details Report provides detailed insight into annual CBO-funded salary and benefit inflation adjustments at the Financial Unit level. It enables users to understand how compensation inflation rates are calculated and how position-level data influences these figures.
Beginning fiscal year 2024/25, the campus transitioned to a new compensation inflation model to provide a simplified and more sustainable way of managing compensation costs. Inflation rates are calculated at the Financial Unit level, factoring in the mix of position types (faculty vs staff), union representation (represented vs policy covered), and approved salary and benefit cost increases.
The calculated inflation rates are then applied against the salary and benefit resource budgets in UCSDPLAN, providing funding for the planning year’s core recurring filled and vacant FTE.
The UCSDPLAN Compensation Inflation Details Report is available from the Business Analytics Hub (bah.ucsd.edu) under the Budget & Planning tab. Standard Cognos Report Consumer roles are required to access. For more access information click here.
Business Scenarios
The report is divided into two main components:
- Compensation Inflation Rates by Financial Unit, the landing view after selecting the required prompts. It displays the following rates for individual Financial Units:
- Annual salary inflation rates
- Annual benefit inflation rates
- Inflation Rate Detail, accessed by clicking a hyperlinked Financial Unit in the main view. This section shows:
- The specific formulas used to calculate the inflation rates
- Position-level data that feeds into those calculations
Together, these views provide a transparent, end-to-end look at how compensation resource adjustments are determined.
This report answers the following questions:
- What are the current salary and benefit inflation rates for my Financial Unit(s)?
- How were these inflation rates calculated?
- What role did the composition of positions within my Financial Unit(s) play in determining these rates?
Critical Concepts
- The BI Consumer JR user role in OFC is required to access the report. To request access, submit the Oracle and Concur Role Requests Form.
- Data availability is governed by row-level security. Users will only see Financial Units for which they have approved access.
- Rates reflect a weighted average calculation based on the current year’s bargaining unit rates applied to each position within a Financial Unit.
- Composite rates are calculated separately for faculty and staff, and are further broken out by Core Fund code within each Financial Unit.
What salary actions are included?
Approved system-wide salary program increases, including Policy Covered and Represented staff merit and step increases, range adjustments, and across-the-board increases. Faculty range adjustments and merit and promotion increases.
What salary actions are excluded?
Because of the variable nature of Faculty Merits and Promotions, these increases will continue to be allocated on a person-by-person basis after the salary actions have been implemented in UCPath and are not included in the compensation inflation calculation described above.
Also excluded are locally approved staff equity increases, reclassifications, promotions, and one-time special awards and lump sum payments.
How to Run
Once launched from the Business Analytics Hub, the report displays a prompt page where results can be filtered by changing selections in one or more prompts.
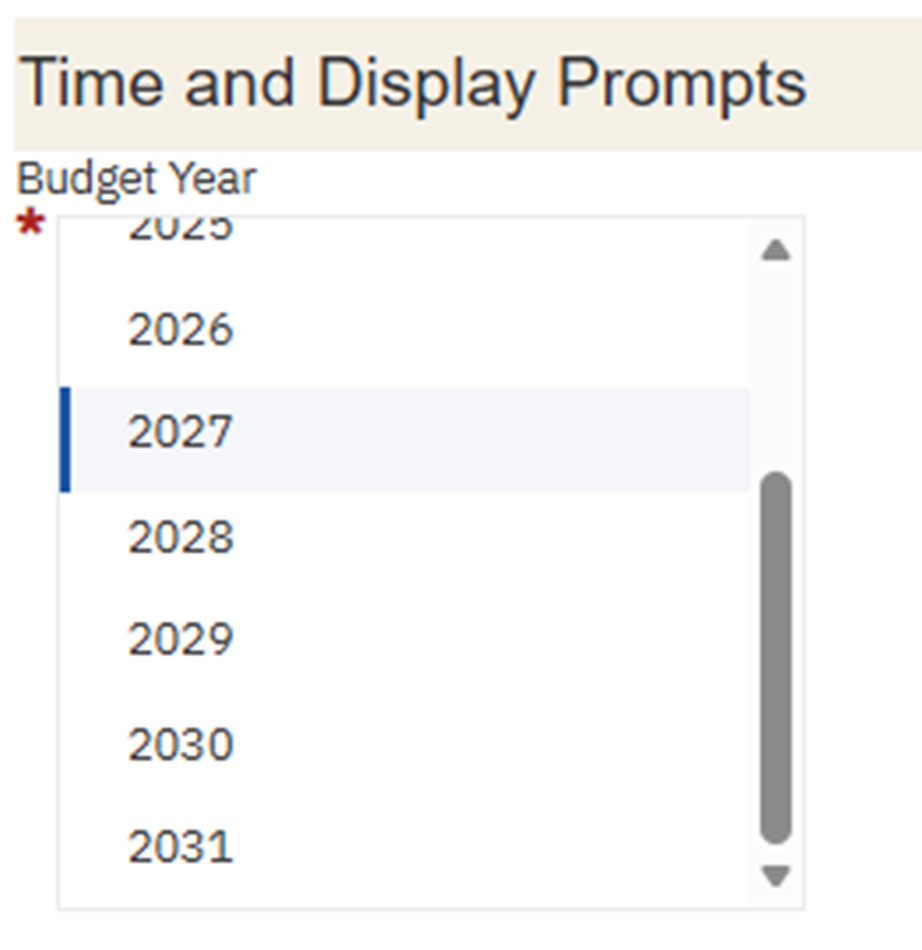
Budget Year
Required. Select the Budget Year from the drop-down.
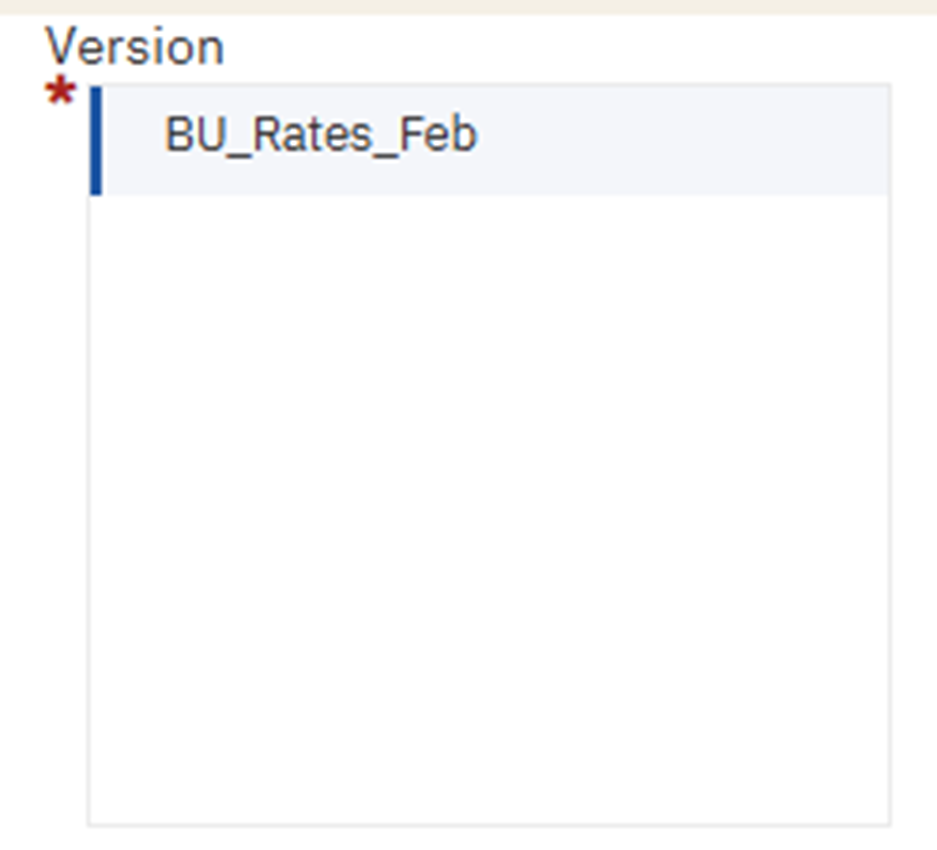
Version
Required. Select the Version within the Budget Year from the drop-down.
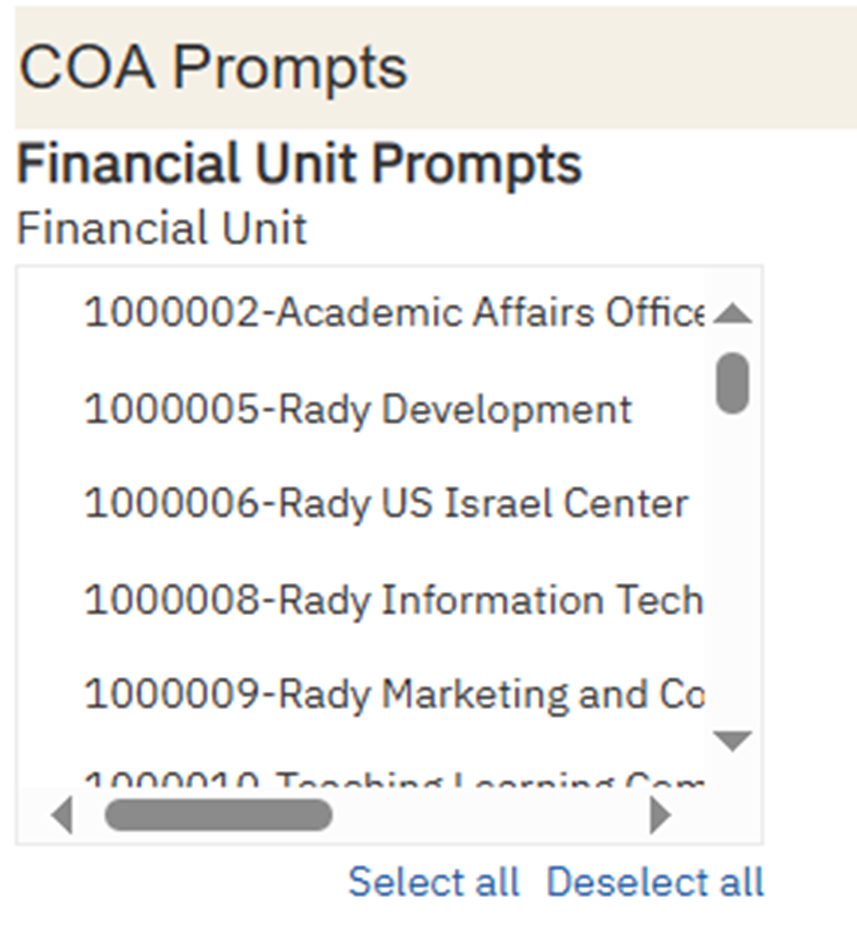
Financial Unit
Optional. Select one or more Financial Units from the list.
- If no Financial Unit is selected, the report will return all Financial Units the user has access to based on row-level security assignments.
- If a Financial Unit is selected to which the user does not have access, the report will return a “No Data Available” message.
Once all Prompt selections are complete, click Finish to generate the report.
Report Views
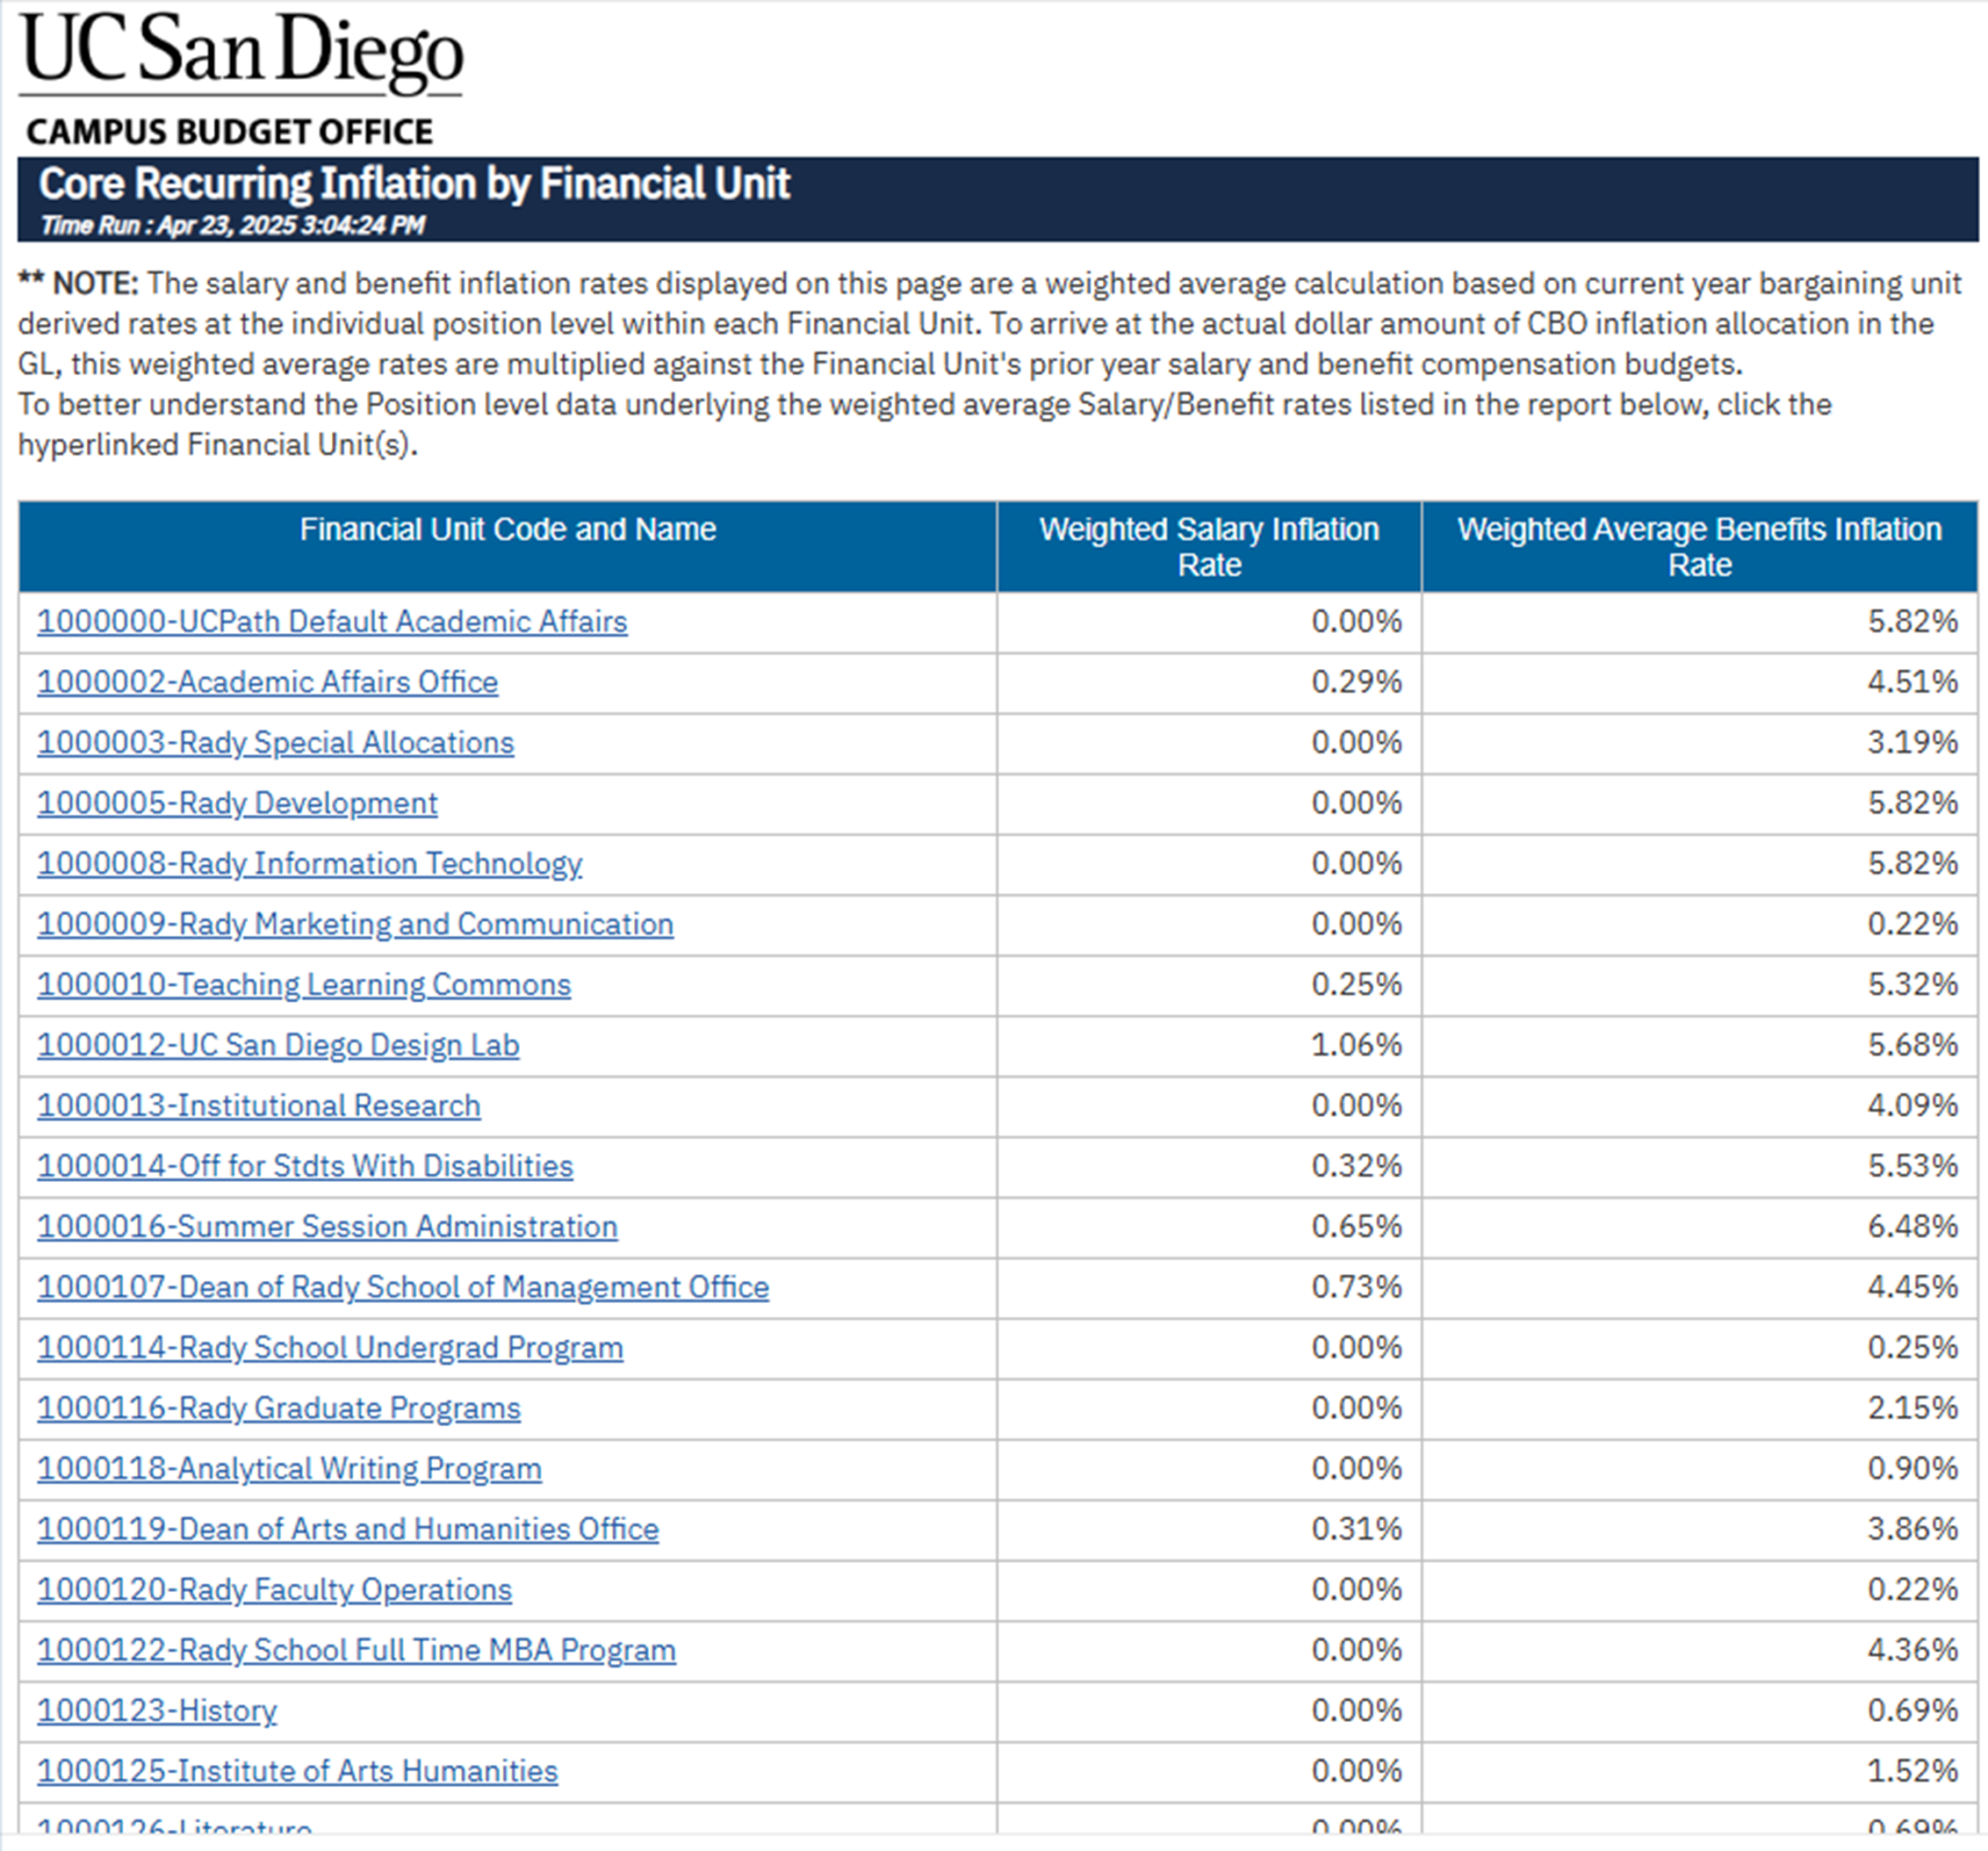
Inflation Rates by Financial Unit
The landing page displays weighted average salary and benefit inflation rates for each Financial Unit. Financial Unit names are hyperlinked - click any Financial Unit to drill into the rate detail view.
Note: The salary and benefit inflation rates displayed on this page are a weighted average calculation based on current year bargaining unit derived rates at the individual position level within each Financial Unit. To arrive at the actual dollar amount of CBO inflation allocation in the GL, these weighted average rates are multiplied against the Financial Unit’s prior year salary and benefit compensation budgets.
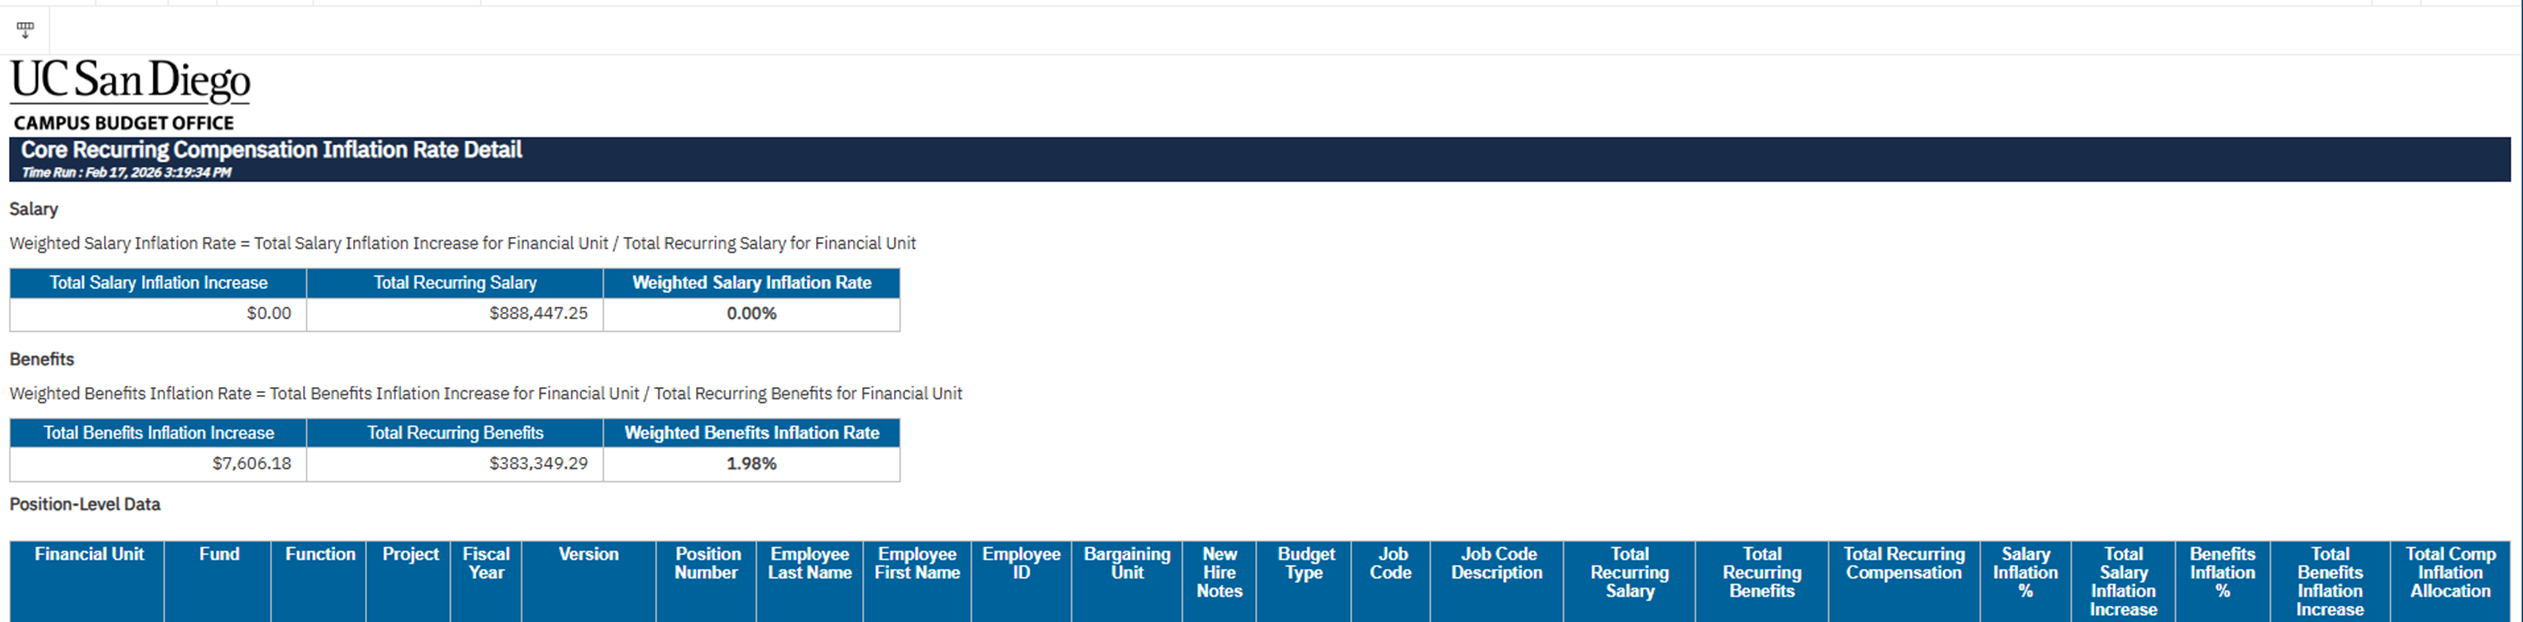
Inflation Rate Detail
The detail view is accessed by clicking a hyperlinked Financial Unit on the landing page. It provides a complete breakdown of how the salary and benefit inflation rates are derived, including:
- Salary Section: Displays the formula for the weighted salary inflation rate, along with total salary inflation increase, total recurring salary, salary savings, and the resulting weighted salary inflation rate.
- Benefits Section: Displays the formula for the weighted benefits inflation rate, along with total benefits inflation increase, total recurring benefits, benefits savings, and the resulting weighted benefits inflation rate.
- Position-Level Data: Lists every position within the Financial Unit that contributes to the rate calculation, including chartstring details, employee information, bargaining unit, budget type, job code, recurring compensation amounts, savings, and the individual salary and benefit inflation percentages and dollar amounts applied to each position.
Refer to the Data Glossary under Get Started on the main BI & Financial Reporting Blink menu for searchable data descriptions and usage rules.