Recharge Operations Dashboard
The Recharge Operations Dashboard provides insights into recharge operations, offering a clear view of performance metrics. It tracks how income and expenses have evolved over time, and effortlessly monitors whether balance remains within the allowable range.
The Recharge Operations Dashboard is available from the Business Analytics Hub (bah.ucsd.edu) under the Recharge tab.
The dashboard includes the following pages:
- Summary
- PPM Revenue and Expense
- GL Revenue and Expense
Report Demo
You can find the Recharge Operations Dashboard Demo on the UCSD Budget & Finance MediaSpace channel - Financial Report Demos playlist.
Access
Access has been provisioned to anyone with the Oracle BI Consumer JR role. Staff who do not have access should request the Oracle role. Access failure appears as error "Unable to load requested view. Displaying home view instead."
- Navigate to bah.ucsd.edu.
- Select Budget & Finance.
- If using the List View, look for Recharge Operations Dashboard in the list or use the search bar at the top right and click the dashboard name
- If using the Card View, click the Recharge tab and click Launch on the Recharge Operations Dashboard tile
- Use your Active Directory credentials to sign in, if prompted.
Navigation
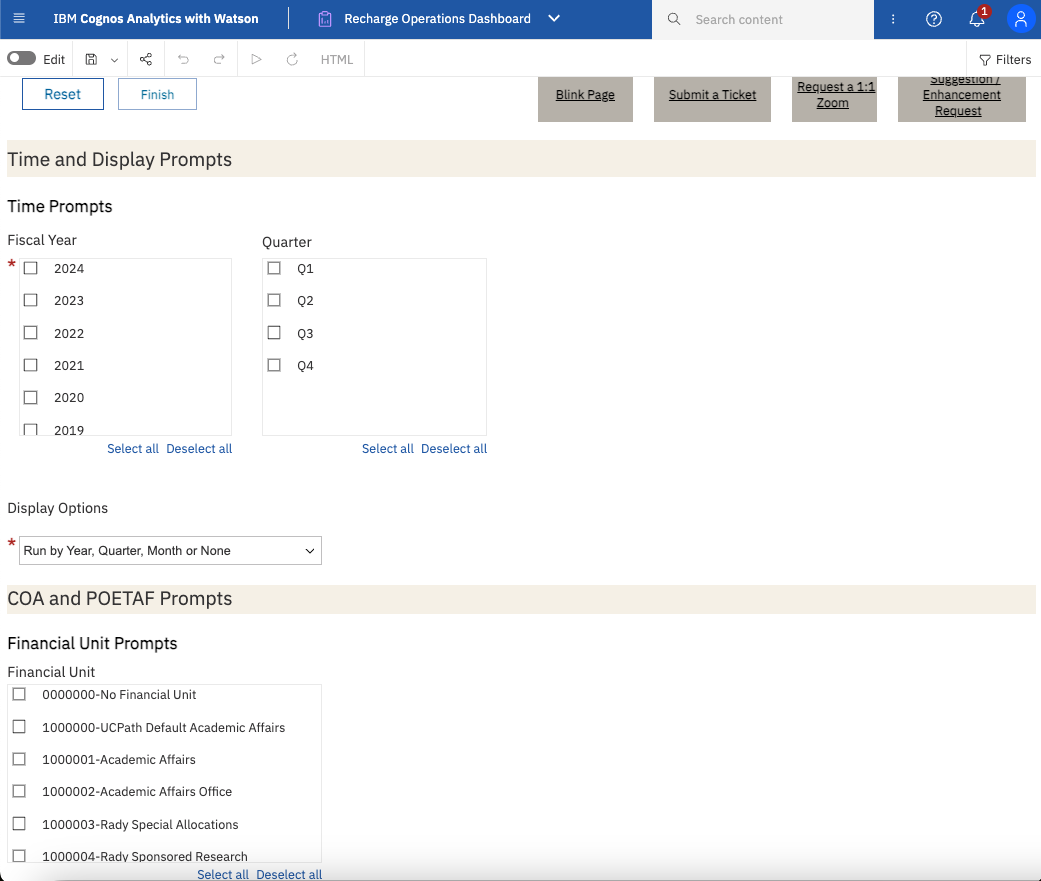
- Use these parameters to filter for the data you want to view
- These filters can be used in combination or individually to produce desired results
-
- Fiscal Year Prompt is required and multi-select.
- Select one or more Quarters in conjunction with one or more Fiscal Years to compare performance of specific quarters year over year.
- Use the Display Options prompt to determine whether revenue and expense data is displayed by Year, Quarter, or Month. If you do not wish to break data out by Year, Quarter, or Month, select None.
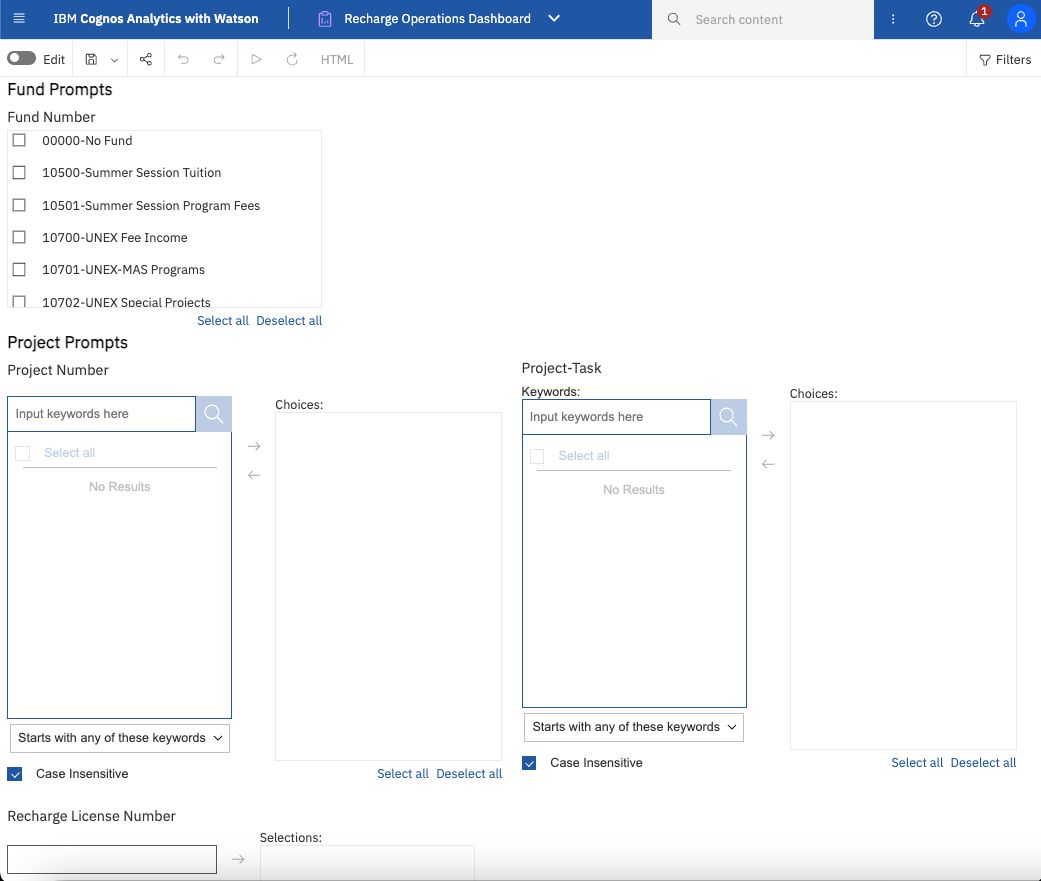
- Project Number Do not use in conjunction with the Project-Task prompt.
- Project-Task Do not use in conjunction with the Project prompt.
- A Recharge License Number is associated with one or more projects that all relate to a single recharge facility. Search for the License Number provided to you by Costing Policy and Analysis to search for all projects associated with it.
Each page of the dashboard contains on-page prompts for deeper exploration of data. These on-page prompts are filtered by the original selections made on the prompt page.
Summary
Summary
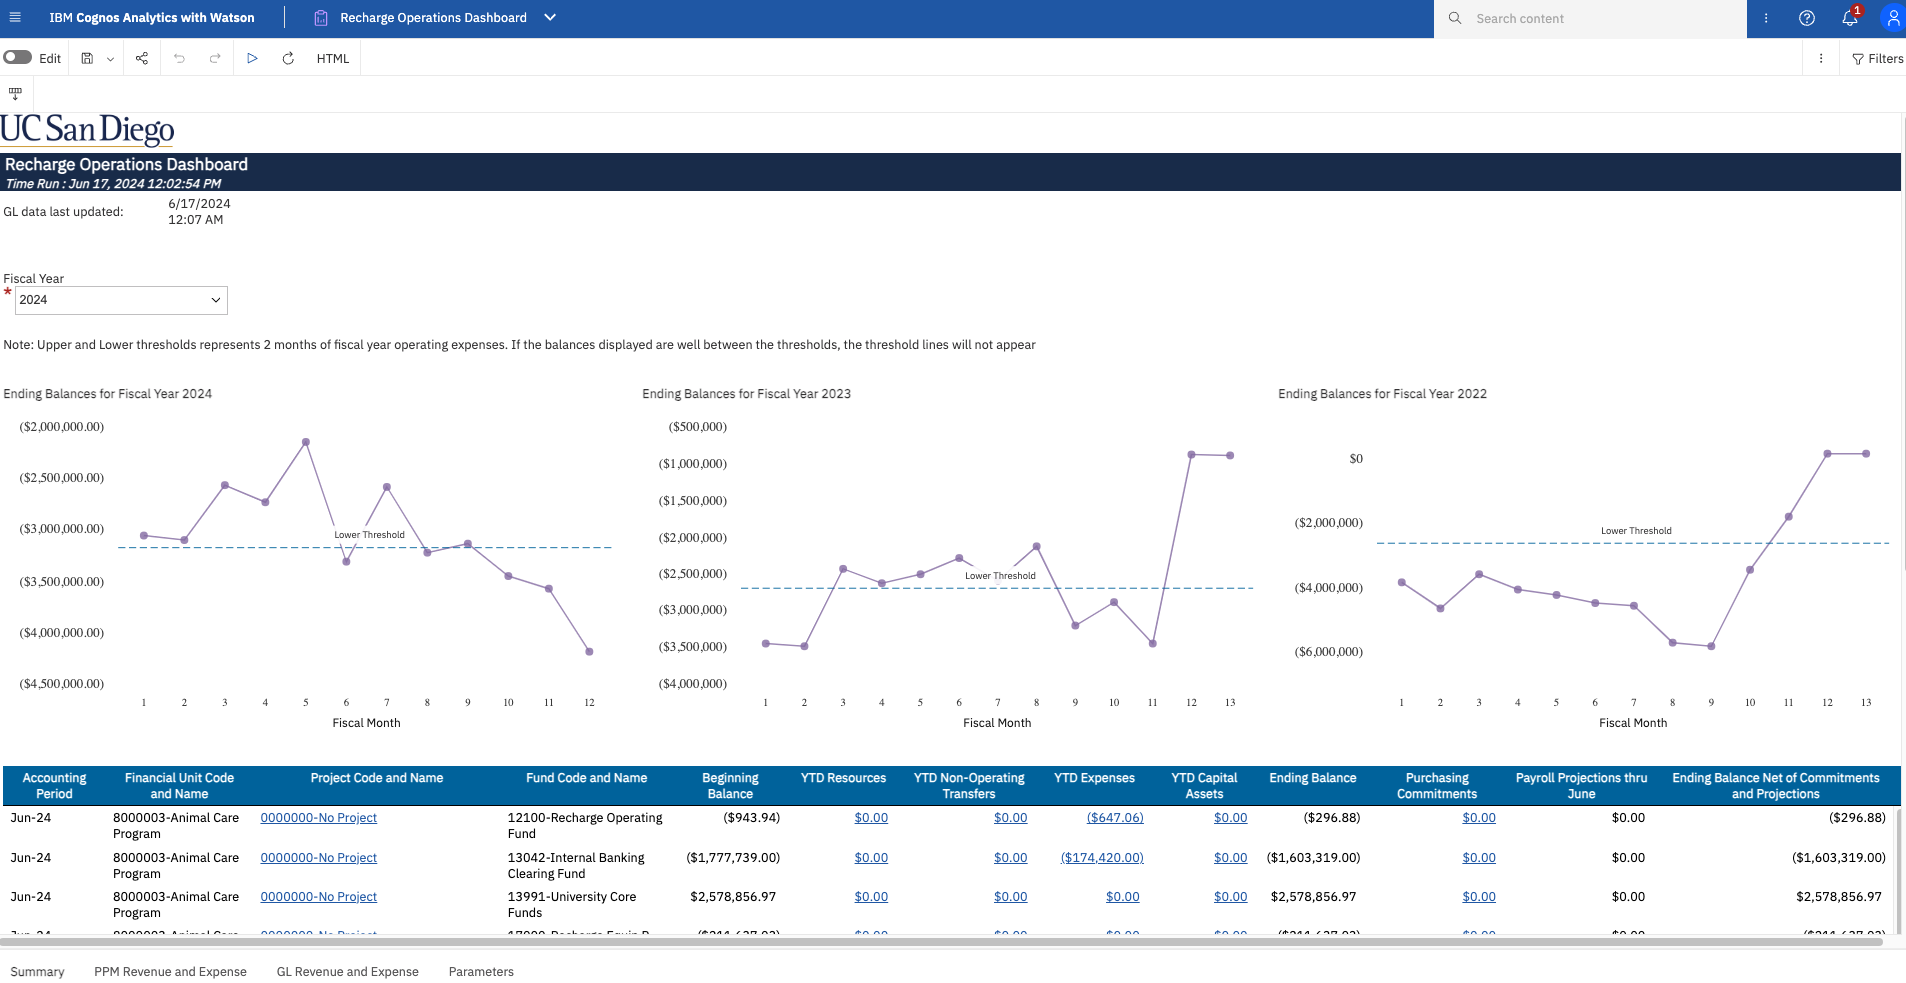
- Graphs Show current balances as well as balances over time on fund 12100. The allowable carryforward ceiling and floor of 2 months of fiscal year operating expenses is shown on the graphs as a dotted line.
- The balances table is identical to that on GL Project Balances.
Business Scenarios
- What is the balance for my recharge facility?
- How are my recharge operations performing?
- How have my income and expenses changed over time?
- Is my carryforward balance within the allowable range?
Report Views
Refer to the Data Glossary under Get Started on the main BI & Financial Reporting Blink menu for searchable data descriptions and usage rules.
PPM Revenue and Expense
Summary
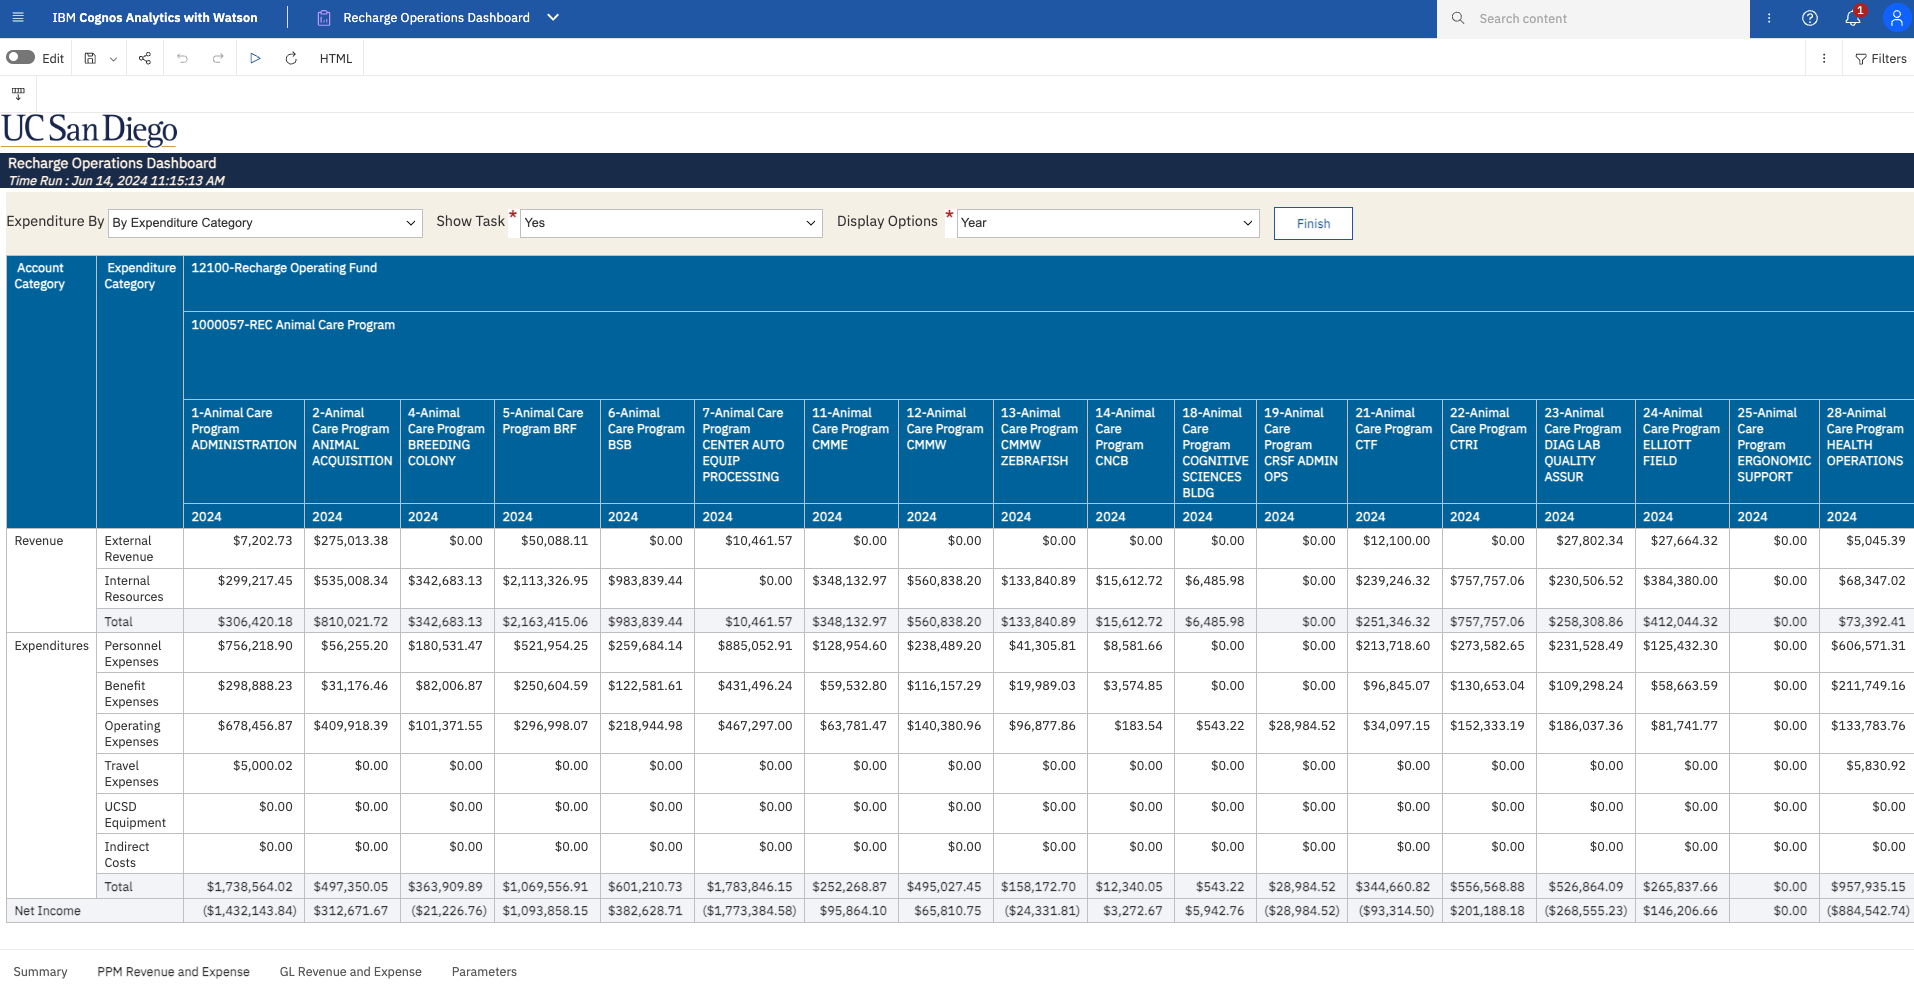
- Display revenues and expenses based on PPM data by task.
- Recharge income and intercampus subaward income post to PPM as negative costs; this report recategorizes that internal income as revenue.
- There are three on-page prompts so you can adjust settings without returning to the prompt page:
- View by Expenditure Category for a more condensed appearance or By Expenditure Type for more detailed insight.
- Show (default) or Hide Task to view data summarized by Project.
- Display Options by Year, Quarter, Month or None
Report Views
Refer to the Data Glossary under Get Started on the main BI & Financial Reporting Blink menu for searchable data descriptions and usage rules.
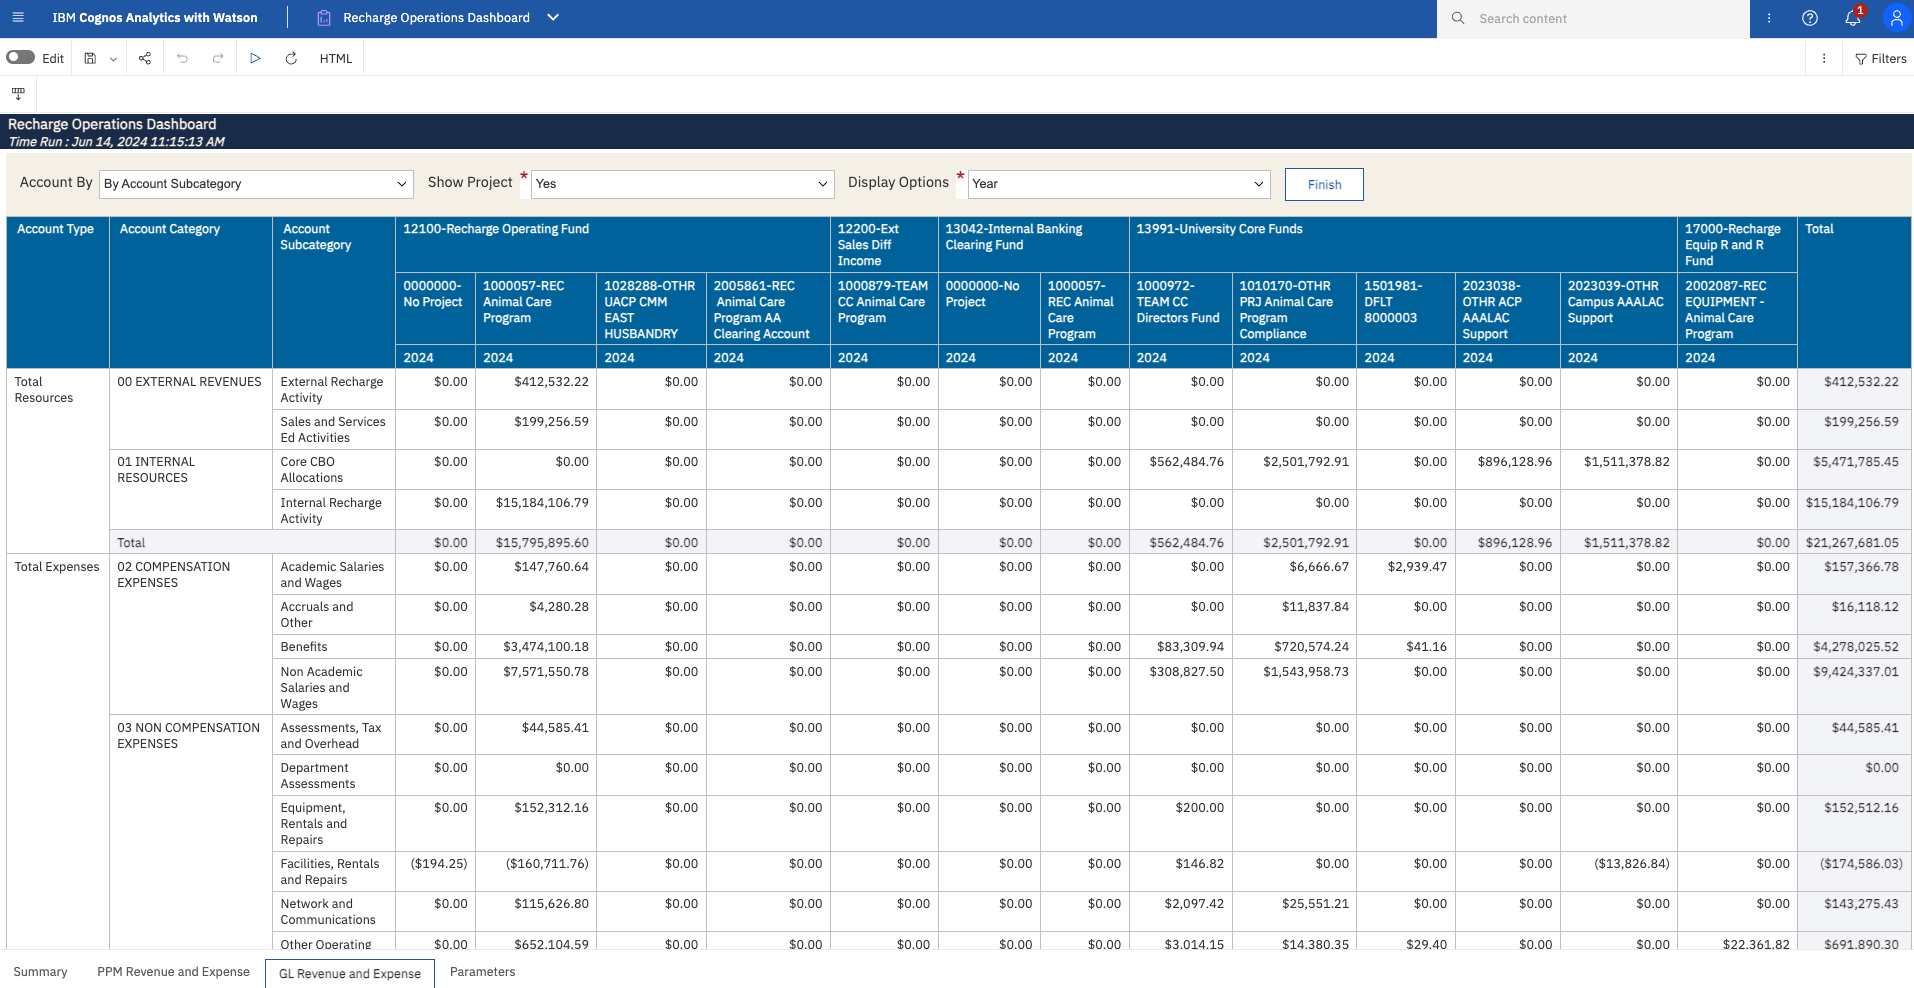
GL Revenue and Expense
Summary
- Display internal/external revenues and expenses based on GL data by fund.
- There are three on-page prompts so you can adjust settings without returning to the prompt page:
- View By Account Subcategory for a more condensed appearance or By Account Code for more detailed insight.
- Show (default) or Hide Project to view data summarized by Fund.
- Display Options by Year, Quarter, Month or None
Report Views
Refer to the Data Glossary under Get Started on the main BI & Financial Reporting Blink menu for searchable data descriptions and usage rules.
Release Notes & Communications
| Date | Release Notes & Communications |
|---|---|
| 7/23/2024 Budget & Finance Weekly Digest | The Recharge Operations Dashboard provides insights into recharge operations, offering a clear view of performance metrics. It tracks how income and expenses have changed over time, and monitors whether balances remain within the allowable range. Read more about this dashboard on Blink. |
