Budget vs Actual Report
The UCSD Budget vs Actual report provides the user with budget, actual, carryforward balance, and budget variances in a table format.
To access the report, visit the Planning and Budgeting Dashboard in the Business Analytics Hub. Standard Report Consumer roles are required to access. For more access information click here.Overview
To provide a more efficient and user-friendly experience, CBO rebuilt the baseline Budget vs Actual report in Cognos. This approach establishes a foundation for more detailed budget reporting utilizing data in the Activity Hubs.
The report presents Resources, Expenses, and Change in Net Position in a table format and includes the prior year’s carryforward as a beginning balance in the Resources Available Balances (Actuals) section to provide the user with a financial position at any given point in time.
Improvements in this new version of the report include:
- Ability to run a single report for any of the fiscal years since Oracle implementation
- Ability to run a single report with unique tabs for Core Funds, Non-Core Funds, Summary and/or Detail views
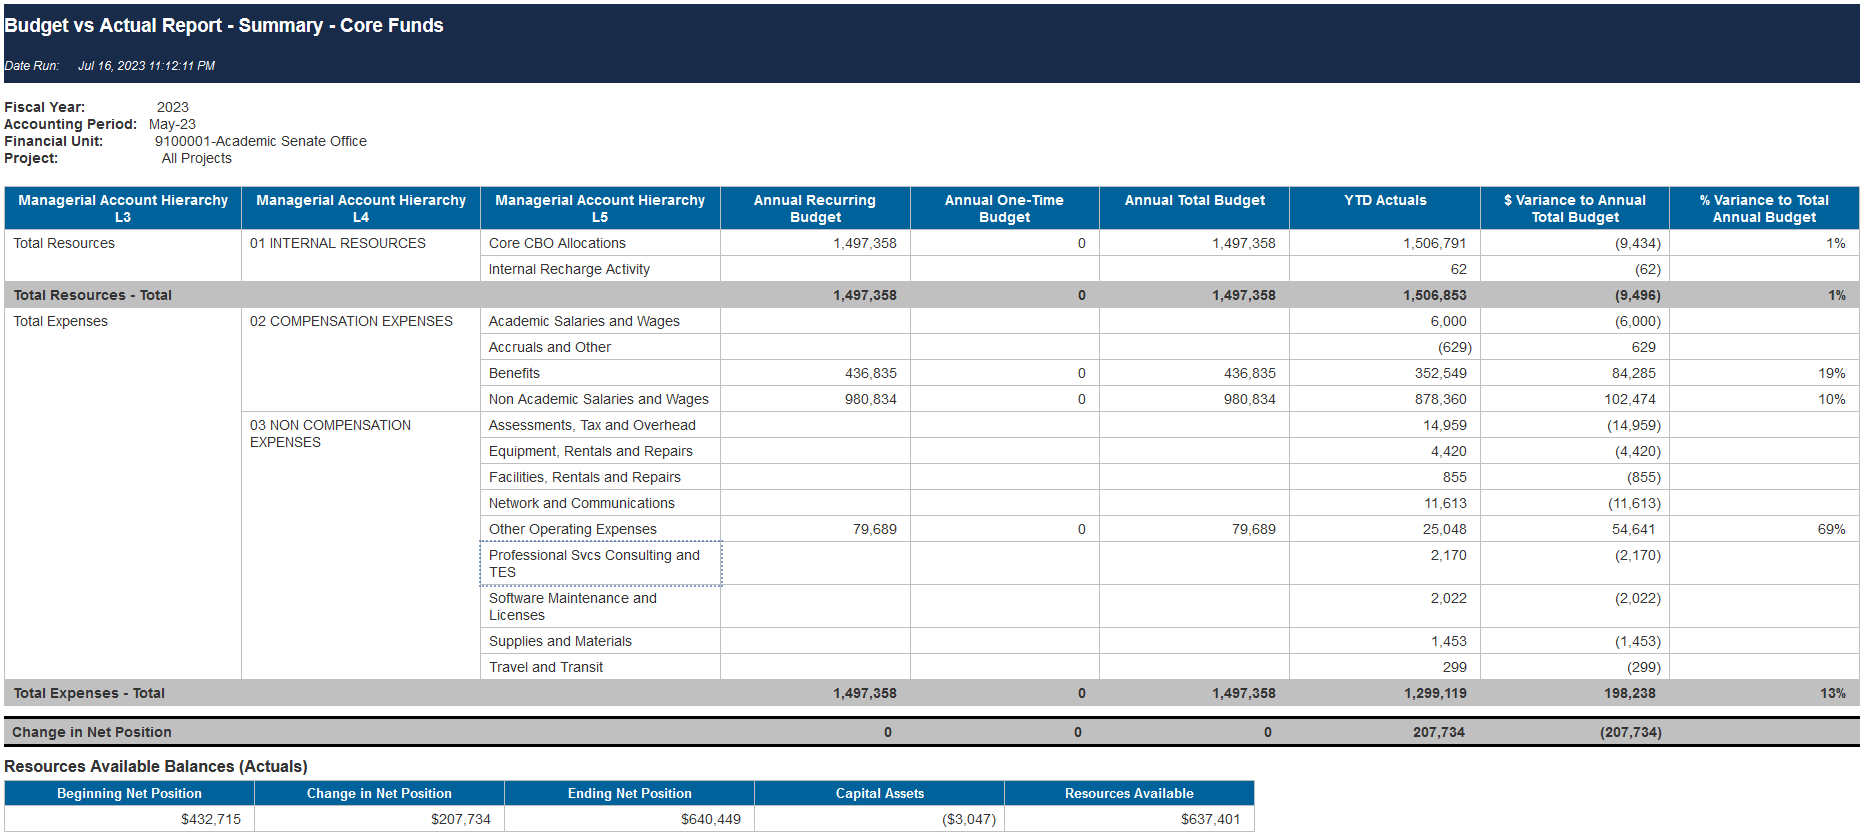
- Core Funds tabs display Recurring and One-Time Annual Budget figures compared against year-to-date (YTD) Actuals
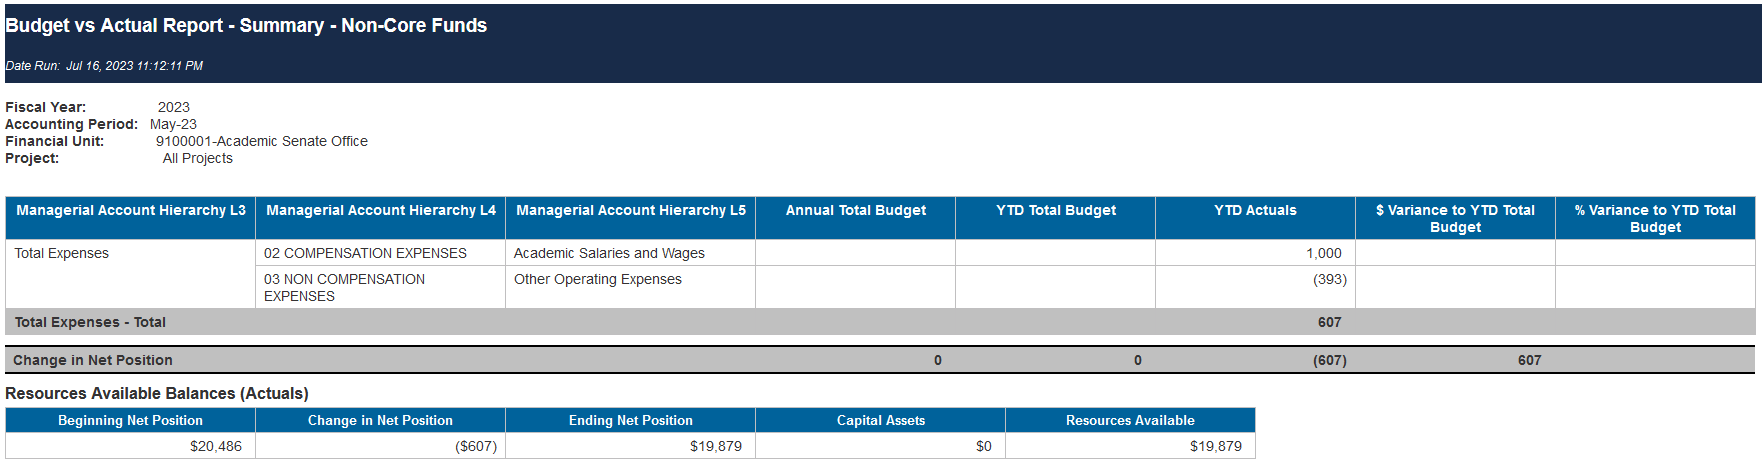
- Non-Core Funds tabs display both Annual and YTD Budget figures compared against YTD Actuals
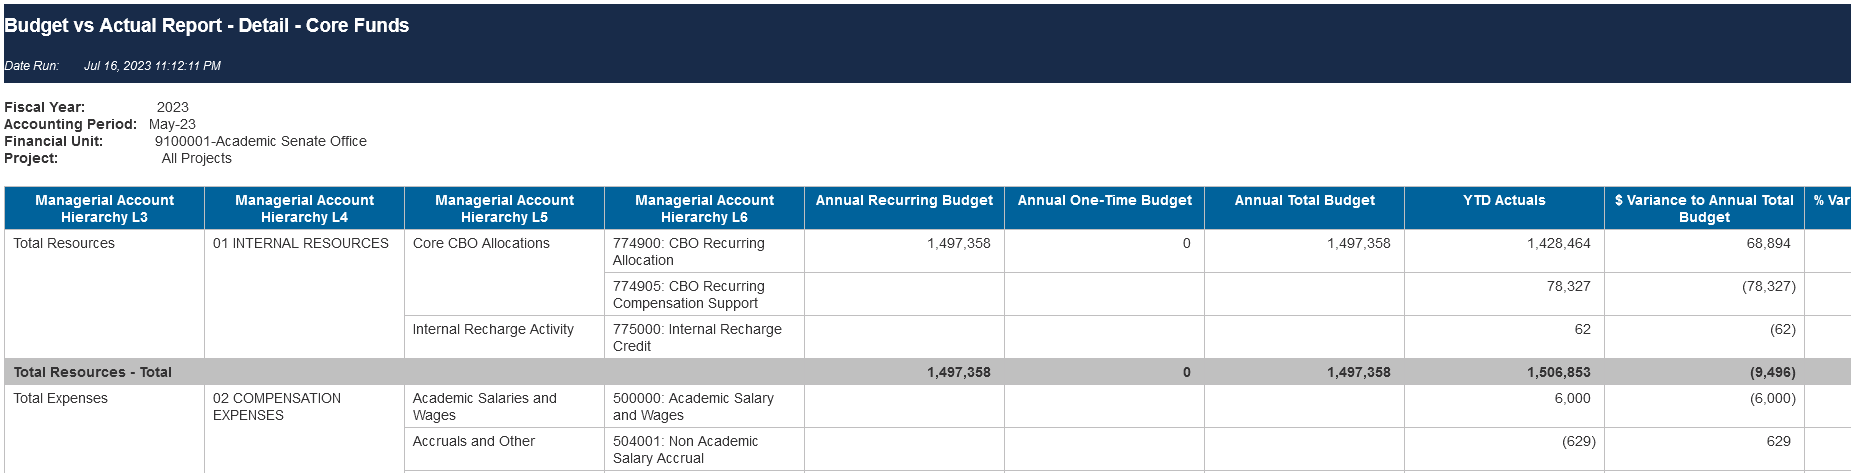
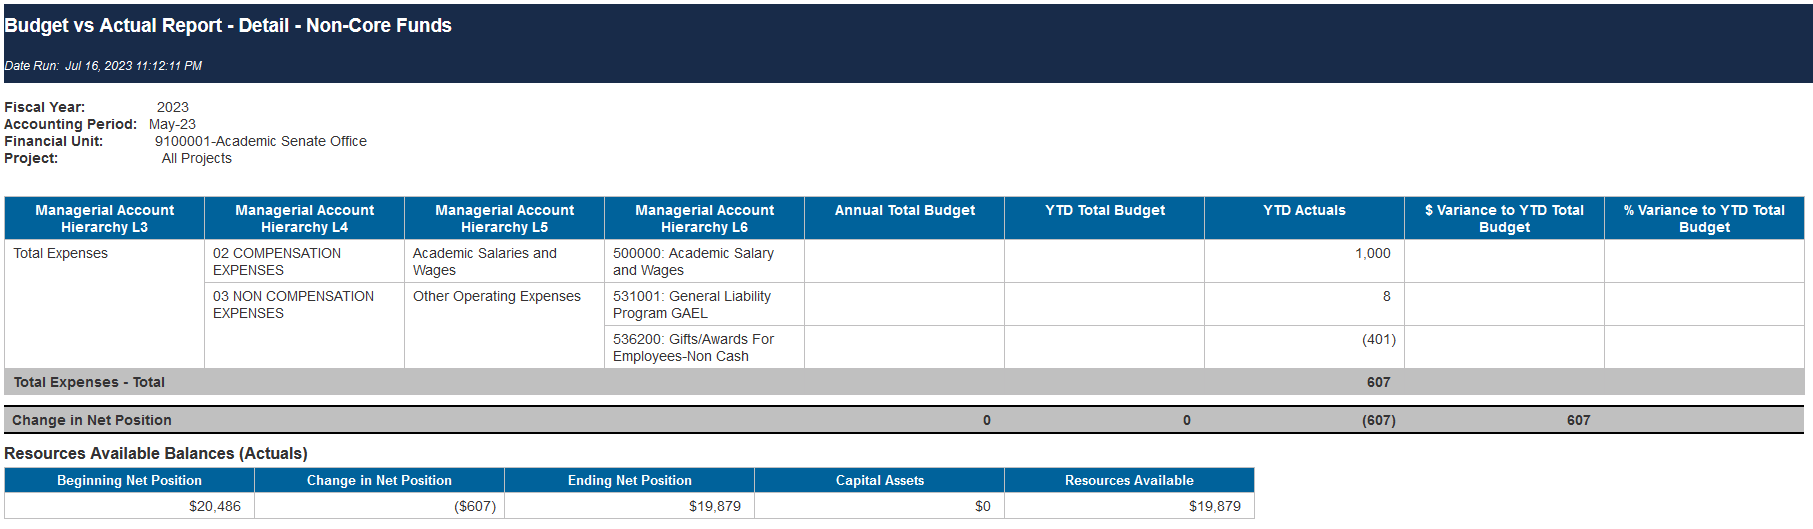
- The detail tabs for both Core Funds and Non-Core Funds provide a breakdown of Resources and Expenses by the posting level (L6) of the Managerial Account hierarchy
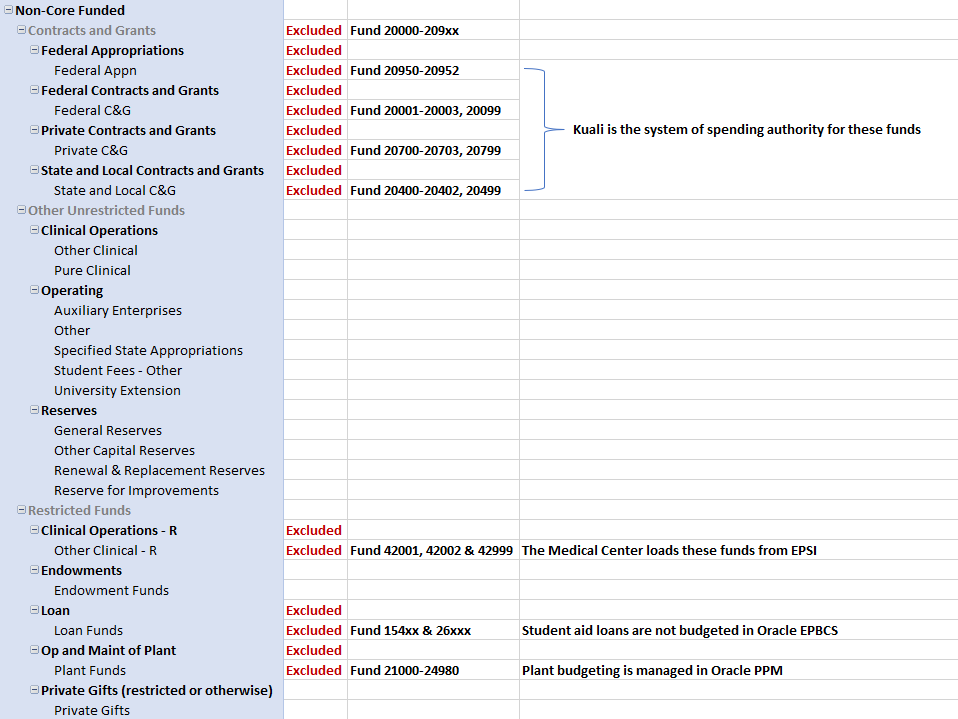
This report uses the Managerial Fund hierarchy and excludes the Internal Loan Fund, 13042.
- When loading budget data to the Oracle General Ledger and the Financial Activity Hub, we exclude a subset of Non-Core Funds budget data. See below for the Funds excluded from the Non-Core Fund Grouping and rationale.
Business Scenarios
This report can be run to answer the following questions:
- How is my FinUnit or Project performing compared to budget?
- Is my FinUnit or Project in net surplus or net deficit?
- What is the July 1 Beginning Net Position of my FinUnit or Project?
- What is the Current Ending Net Position of my FinUnit or Project?
- What is the amount purchased for Capital Assets for my FinUnit or Project?
- What is the amount of Resources Available for my FinUnit or Project?
Critical Concepts
Applies to any version (Core Funds, Non-Core Funds) of the report:
- The General Ledger Inquiry and Reporting JR and BI Consumer JR user roles in OFC are required to access the report.
- The Fiscal Year, Accounting Period, and at least one of the Financial Unit prompts must be populated with a selection to generate the report. The Project prompt is optional.
- The prompt fields include:
- Fiscal Year
- Accounting Period
- Financial Unit
- Project
- Report rows reflect groupings within the Managerial Reporting Account Hierarchy, not the standard financial account hierarchy.
- Capital Asset Purchases are not accounted for as expenses in the income statement and therefore are not included in the calculation of Change in Net Position or Ending Net Position
- To assist with deriving a unit's remaining Resources Available, capital asset purchases are reflected after Ending Position as a reduction of fund balance
- FD_13042: Internal Loan, is excluded from this report as it is not included in the Managerial Reporting Fund Hierarchy
Definitions:
- Total Resources (account 4xxxxx and some 7xxxxx) and Total Expenses (account 5xxxxx and some 7xxxxx) are YTD amounts based on the accounting period selected in the user prompt.
- Change in Net Position = Net of Total Resources and Total Expenses.
- Beginning Net Position = Fund balances from the October distribution of prior year Net Activity to account 300000 at the financial unit and project level.
- Ending Net Position = Change in Net Position plus Beginning Net Position.
- Capital Assets = amounts posted to level 16000B in the Chart of Accounts.
- Resources Available = Ending Net Position minus Capital Assets. This represents the amount available to spend but does not include encumbrances or commitments. The resources available balances section is calculated using YTD Actuals.
How to Run
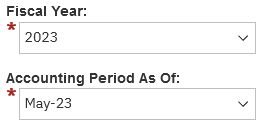
Fiscal Year and Accounting Period
- Enter the desired Fiscal Year (YYYY) and Accounting Period (Mmm-YY) using the drop-down list for each prompt. Proceed to the Financial Unit prompt.
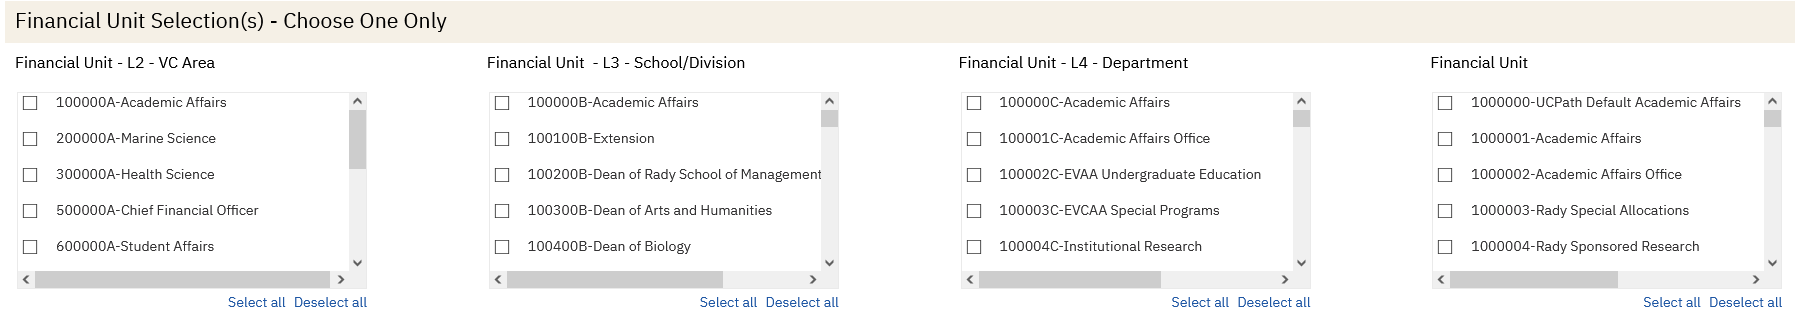
Financial Unit
- Users can select from four levels of the Financial Unit hierarchy: VC Area (L2), School/Division (L3), Department (L4), Posting Level.
- Make a selection for only one of the four Financial Unit prompts. Your Financial Unit selection will be indicated by a checked box.
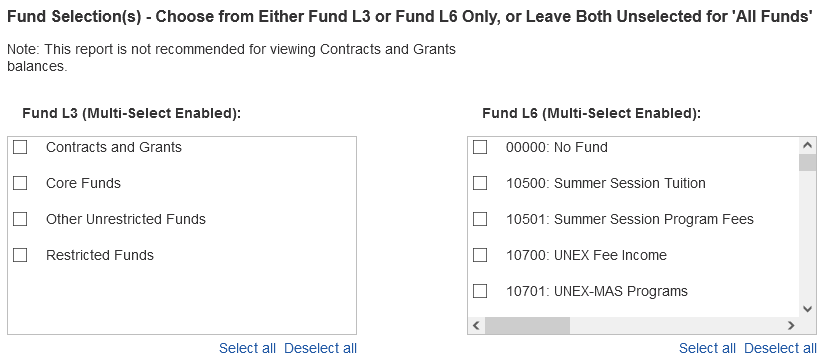
Fund
- The Fund prompt is optional. Users may choose from either Managerial Fund L3 or L6 only, or the user can leave both prompts unselected to run the report for ‘All Funds’.
- Users can select from four types of the Managerial Fund L3 hierarchy: Contracts and Grants, Core Funds, Other Unrestricted Funds, Restricted Funds.
- The report can be run for a single, multiple, or all Fund types.
- The report can also be run for single or multiple Posting level Funds (L6) of the Managerial Fund hierarchy.
Project
- The Project prompt is optional. If known, you may enter the 7-digit Project Number directly in the search field.
- Click on the blue magnifying glass button to return search results. Click the button next to your desired Project.

Once all Prompt selections are complete, click Finish to generate the report.
Report Views
The report output displays 4 separate tabs which can be selected at the bottom of the report:
- Summary – Core Funds
- Summary – Non-Core Funds
- Detail – Core Funds
- Detail – Non-Core Funds
Refer to the Data Glossary under Get Started on the main BI & Financial Reporting Blink menu for searchable data descriptions and usage rules.