Analytics for Individual Videos
Finding and understanding the analytics for a video may be challenging.
This tutorial will address analytics for individual videos in Canvas. We'll look at how to find them as well as what the various metrics mean.
There are several sections within the analytics that we'll focus on:
- Views on playback: a snapshot of what parts of your video were viewed the most and least
- Engagement per user: a list of each user's viewing behaviors for the video
- Video performance over time: a variety of metrics about your video tracked over time
- The engagement funnel: a visual representation of how many folks actually ended up watching your video, and how much
- Top countries: where your video is being viewed
- Devices overview: what devices viewers are using to watch your video
- Top domains: where on the internet your video is getting the most traffic
Where to Find Video Analytics
Here's how to find the analytics for an individual video.
- Within Canvas, click "My Media" in the left navigation.
- Find the video in question in your list of media and click the little icon that looks like a graph on its row.
- Use the pull-down menu at the top right of the analytics page to select the date range you're looking for. (The default date range is the past 30 days.)
Views on Playback
This graph can show how many users were viewing the video at particular intervals throughout the video. At a glance, it can give you an indication of what parts of your video are generating the most interest.
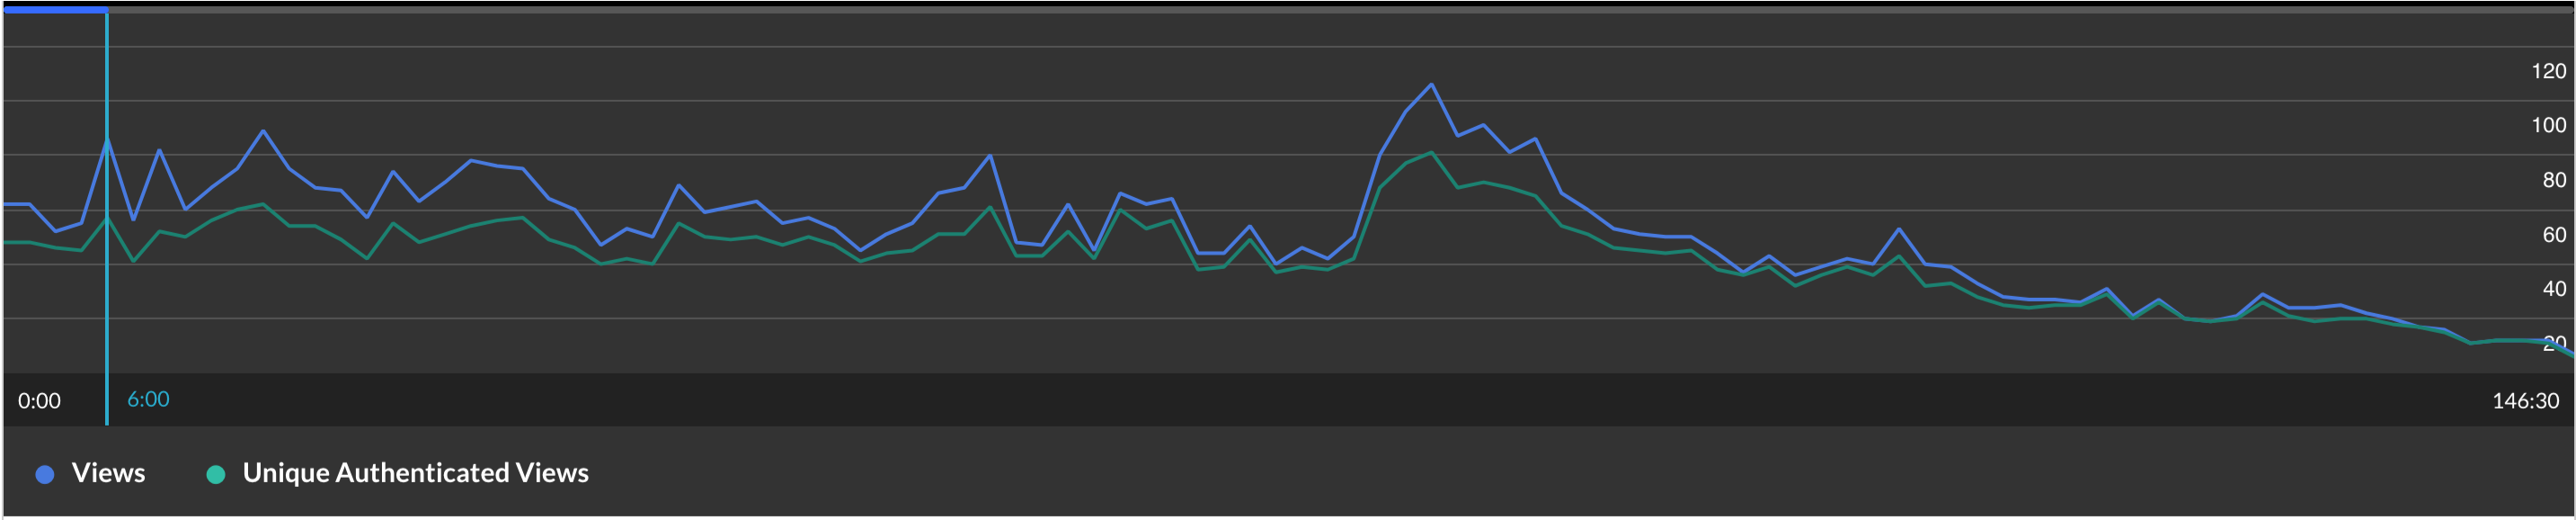
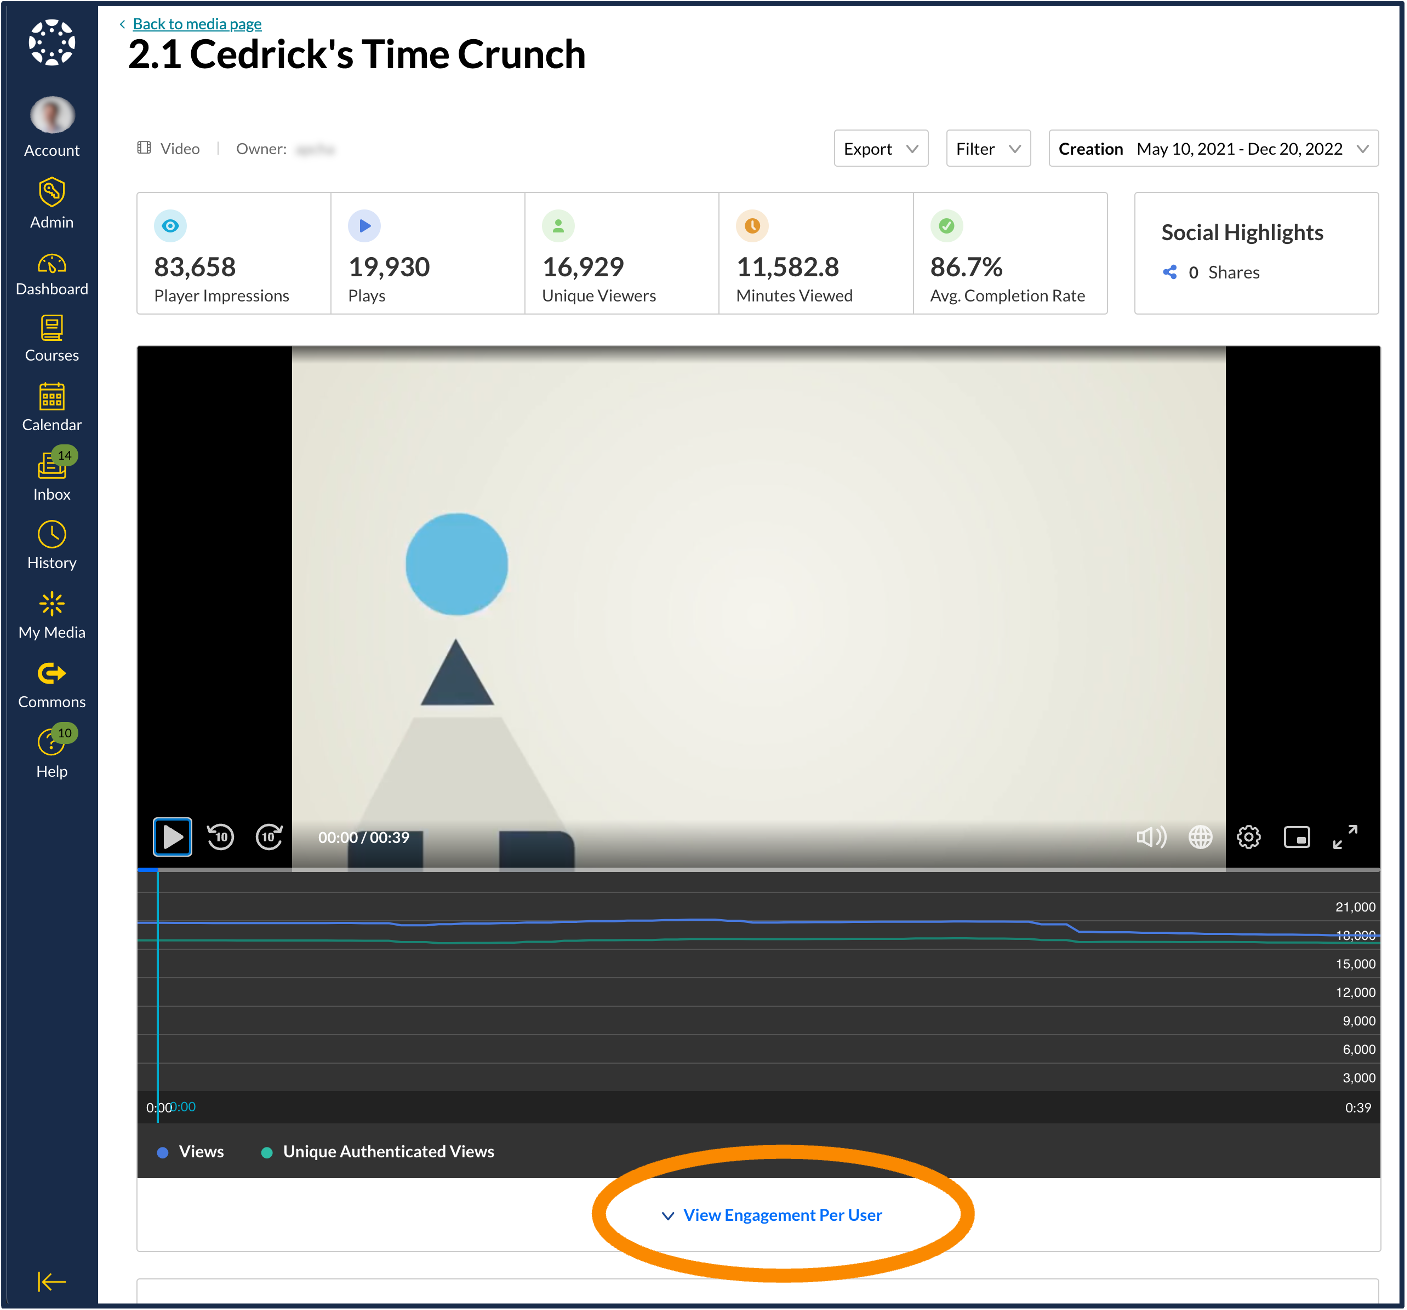
This graph is one of the first things that you might see on the analytics page for an entry. It sits below a copy of the video itself (which can be played if desired).
Metric Definitions
| Metric | Definition | Notes | Question it Addresses |
|---|---|---|---|
| Views | The number of total views for a particular segment of the video | Often "views" will exceed "unique authenticated views" since it counts each viewing session of any user. So if a user watched a particular section twice, they will have added two views. | How many times did people watch this part of the video? |
| Unique authenticated views | How many users watched a particular segment of the video | In Canvas, Kaltura is able to identify students and can determine how many unique users watched a particular segment of the video. If an authenticated user watched a segment twice, it will only count for one unique authenticated view. | How many students watched this part of the video? |
Engagement Per User
"Engagement per user" shows you your individual students' viewing behaviors on this particular video. To view these data, click the "View Engagement Per User" link just below the first graph shown on a video's analytics page.
Metric Definitions
| Metric | Definition | Notes | Question it Addresses |
|---|---|---|---|
| Player impressions | How many times the video was loaded on a page for that user | The number is irrespective of whether or not they clicked "play." | How many times did the student arrive on a webpage that had this video on it? |
| Plays | The number of times the play button was hit | It doesn't relate to how much of the video they watched. The user could have pressed play and then immediately paused the video or closed the window. | How many times did the student click play? |
| Total completion rate | The total percentage of the video watched, across ALL views | "Total completion rate" doesn't report on the same section of a video twice. So if a user watched the same half of a video twice, the 'Total completion rate' would be 50%. If the user watched the first half of the video one day and the second half of the video another day, the 'total Completion rate' will be 100%. | What percentage of this video did the student actually watch? |
| Avg. completion rate | The average percentage of video completion, across all plays | Example: A student watched the video twice. The first time she watched 20% of it, and the second time she watched 80% of it. Her average completion rate would be (20+80) ➗2 plays = 50%. | On average, what percentage of the video did the student watch per viewing session? |
User Engagement Heatmap
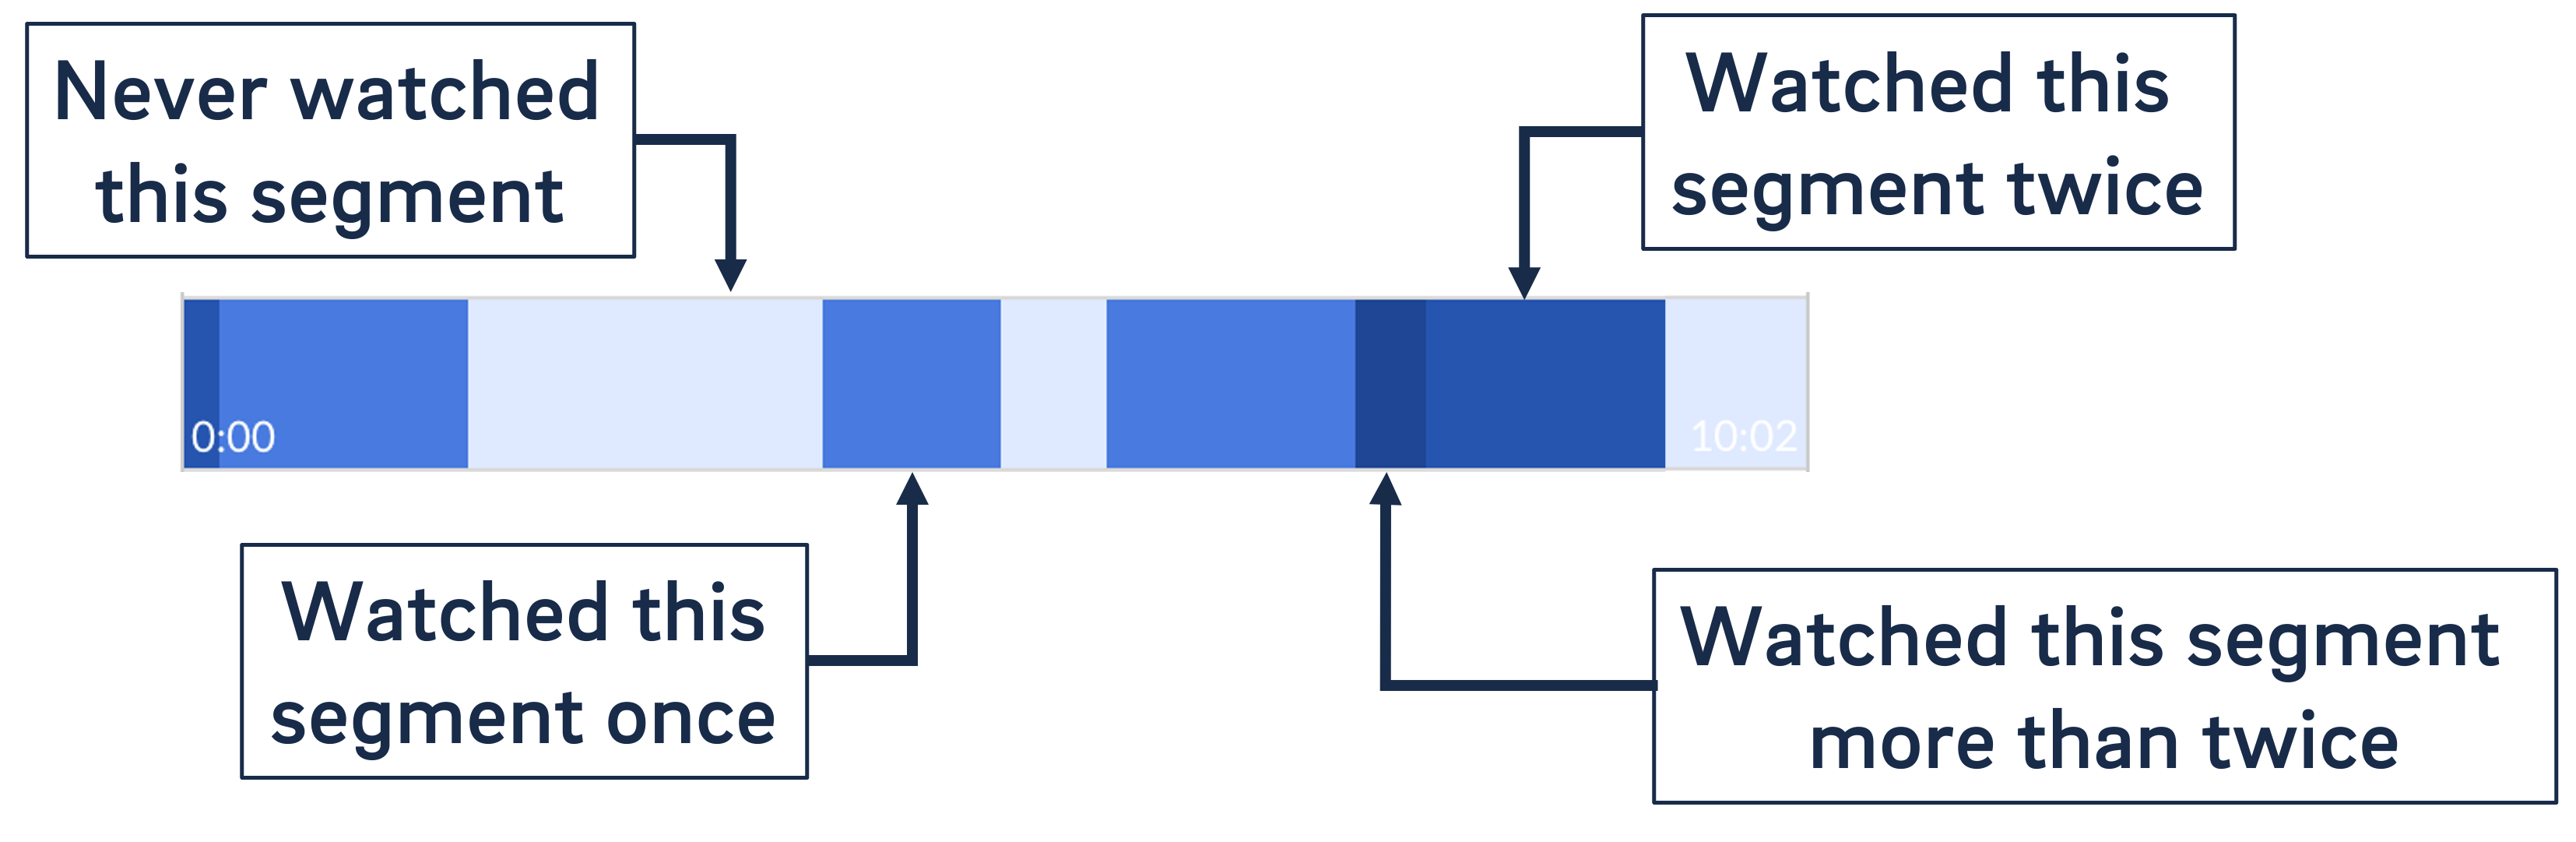
The so-called "user engagement heatmap" is visible on a user-by-user basis. If you've clicked "view engagement per user," you should notice a little carat (triangle) next to each user's name in the list. If you click that carat, the engagement heatmap for that user will display below. You can view the heatmaps for multiple users on a page by clicking multiple carats.
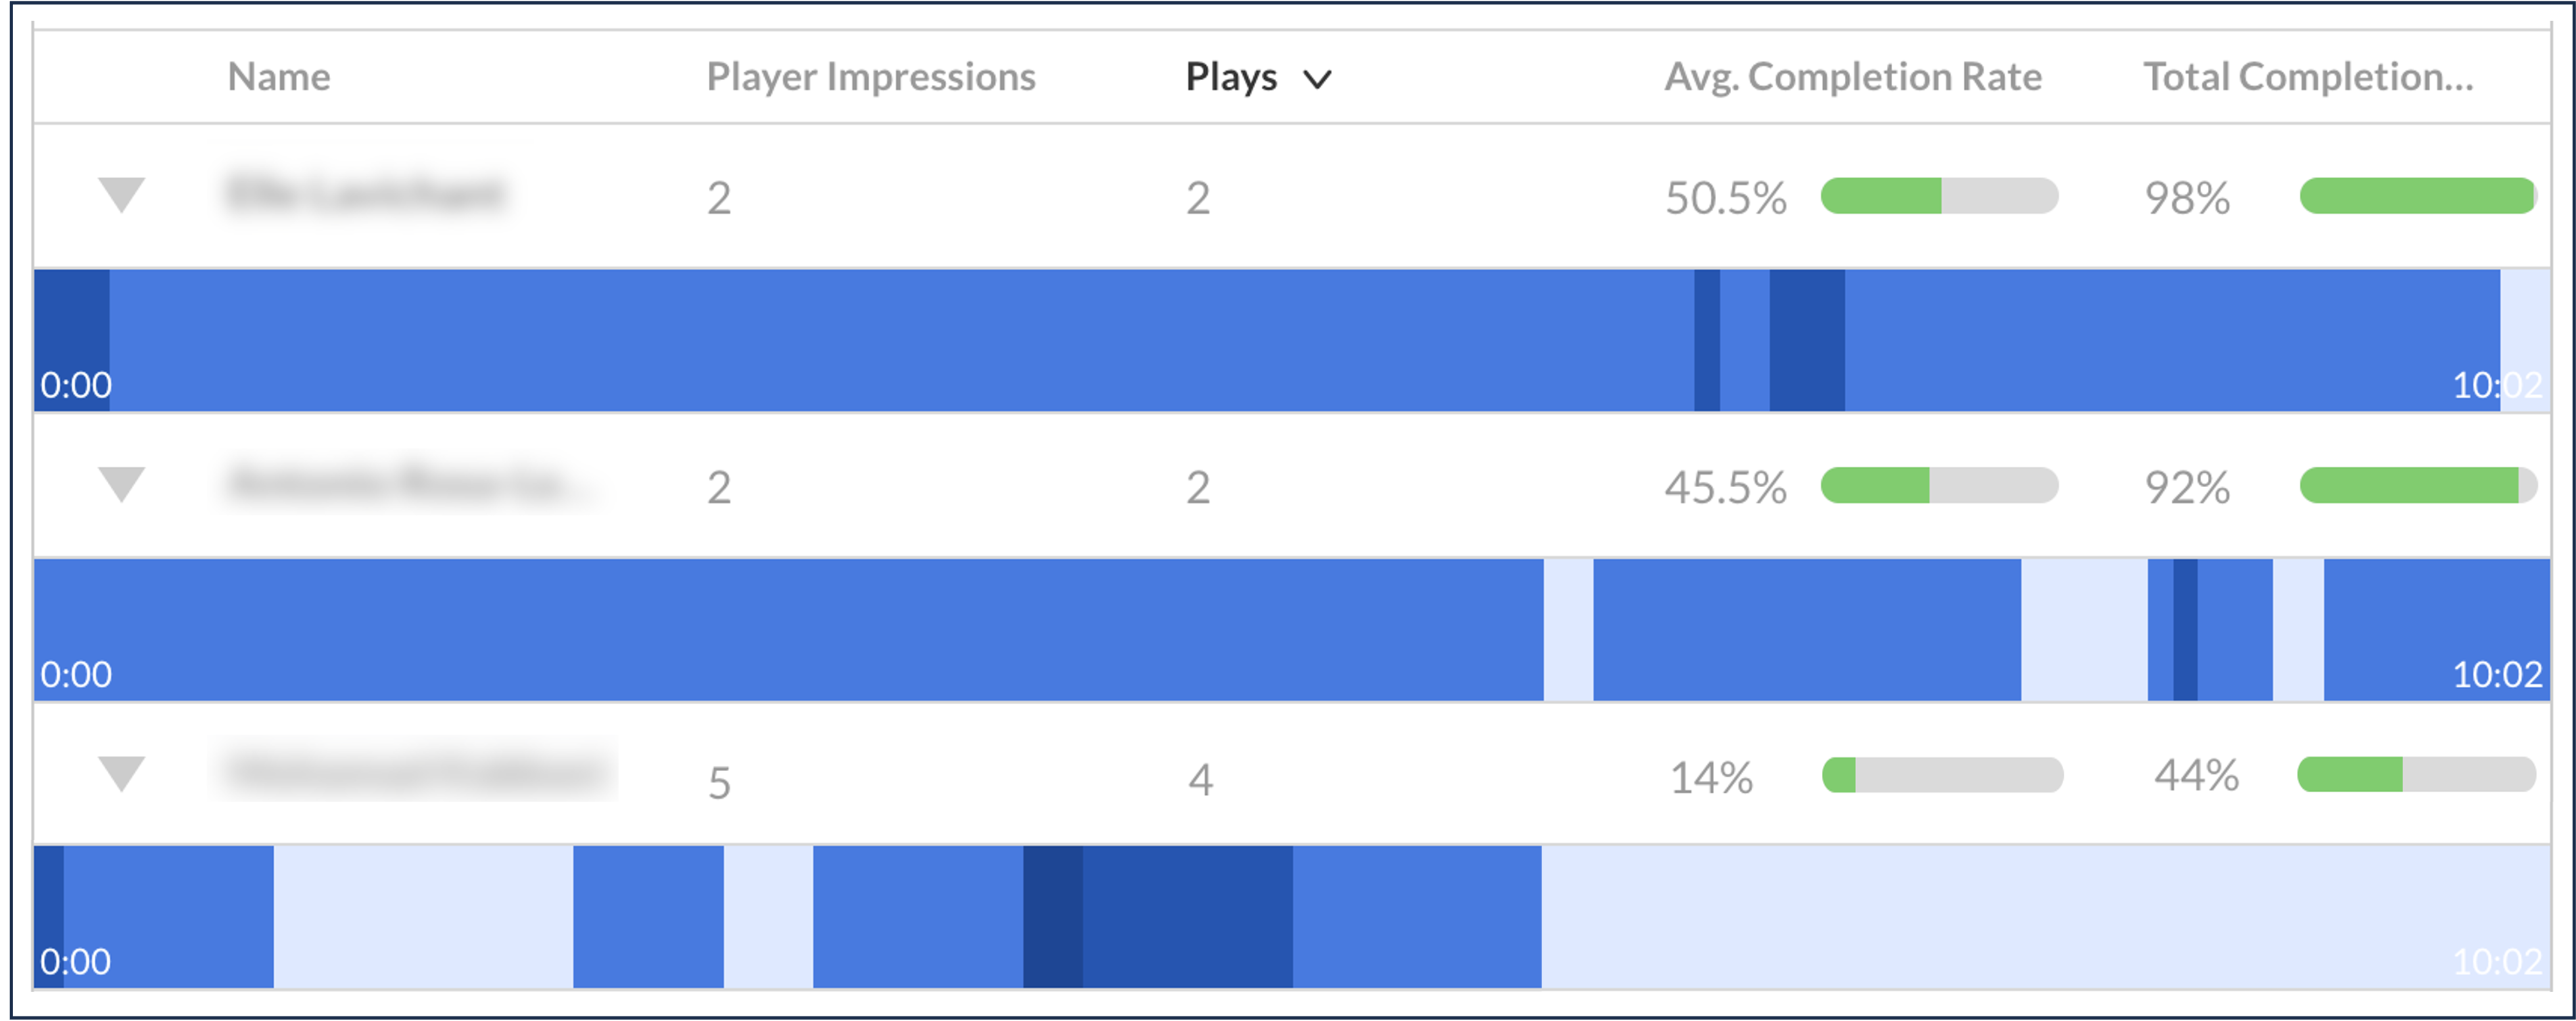
The horizontal bar that spans the width of the window is meant to represent your video's timeline, from start to finish. The heatmap shows you what specific parts of the video the student watched, and whether certain parts were watched once, twice, or more than twice. The darker the blue is, the more times that piece of the video was watched.
Video Performance Over Time
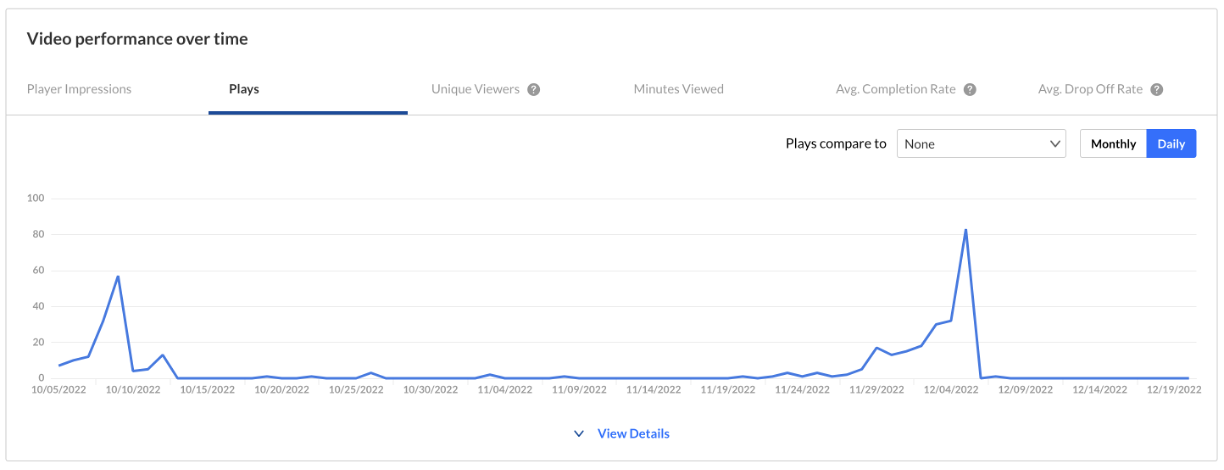
The graph titled "video performance over time" shows you a variety of metrics over the time period you identify at the top of the analytics page.
Metric Definitions
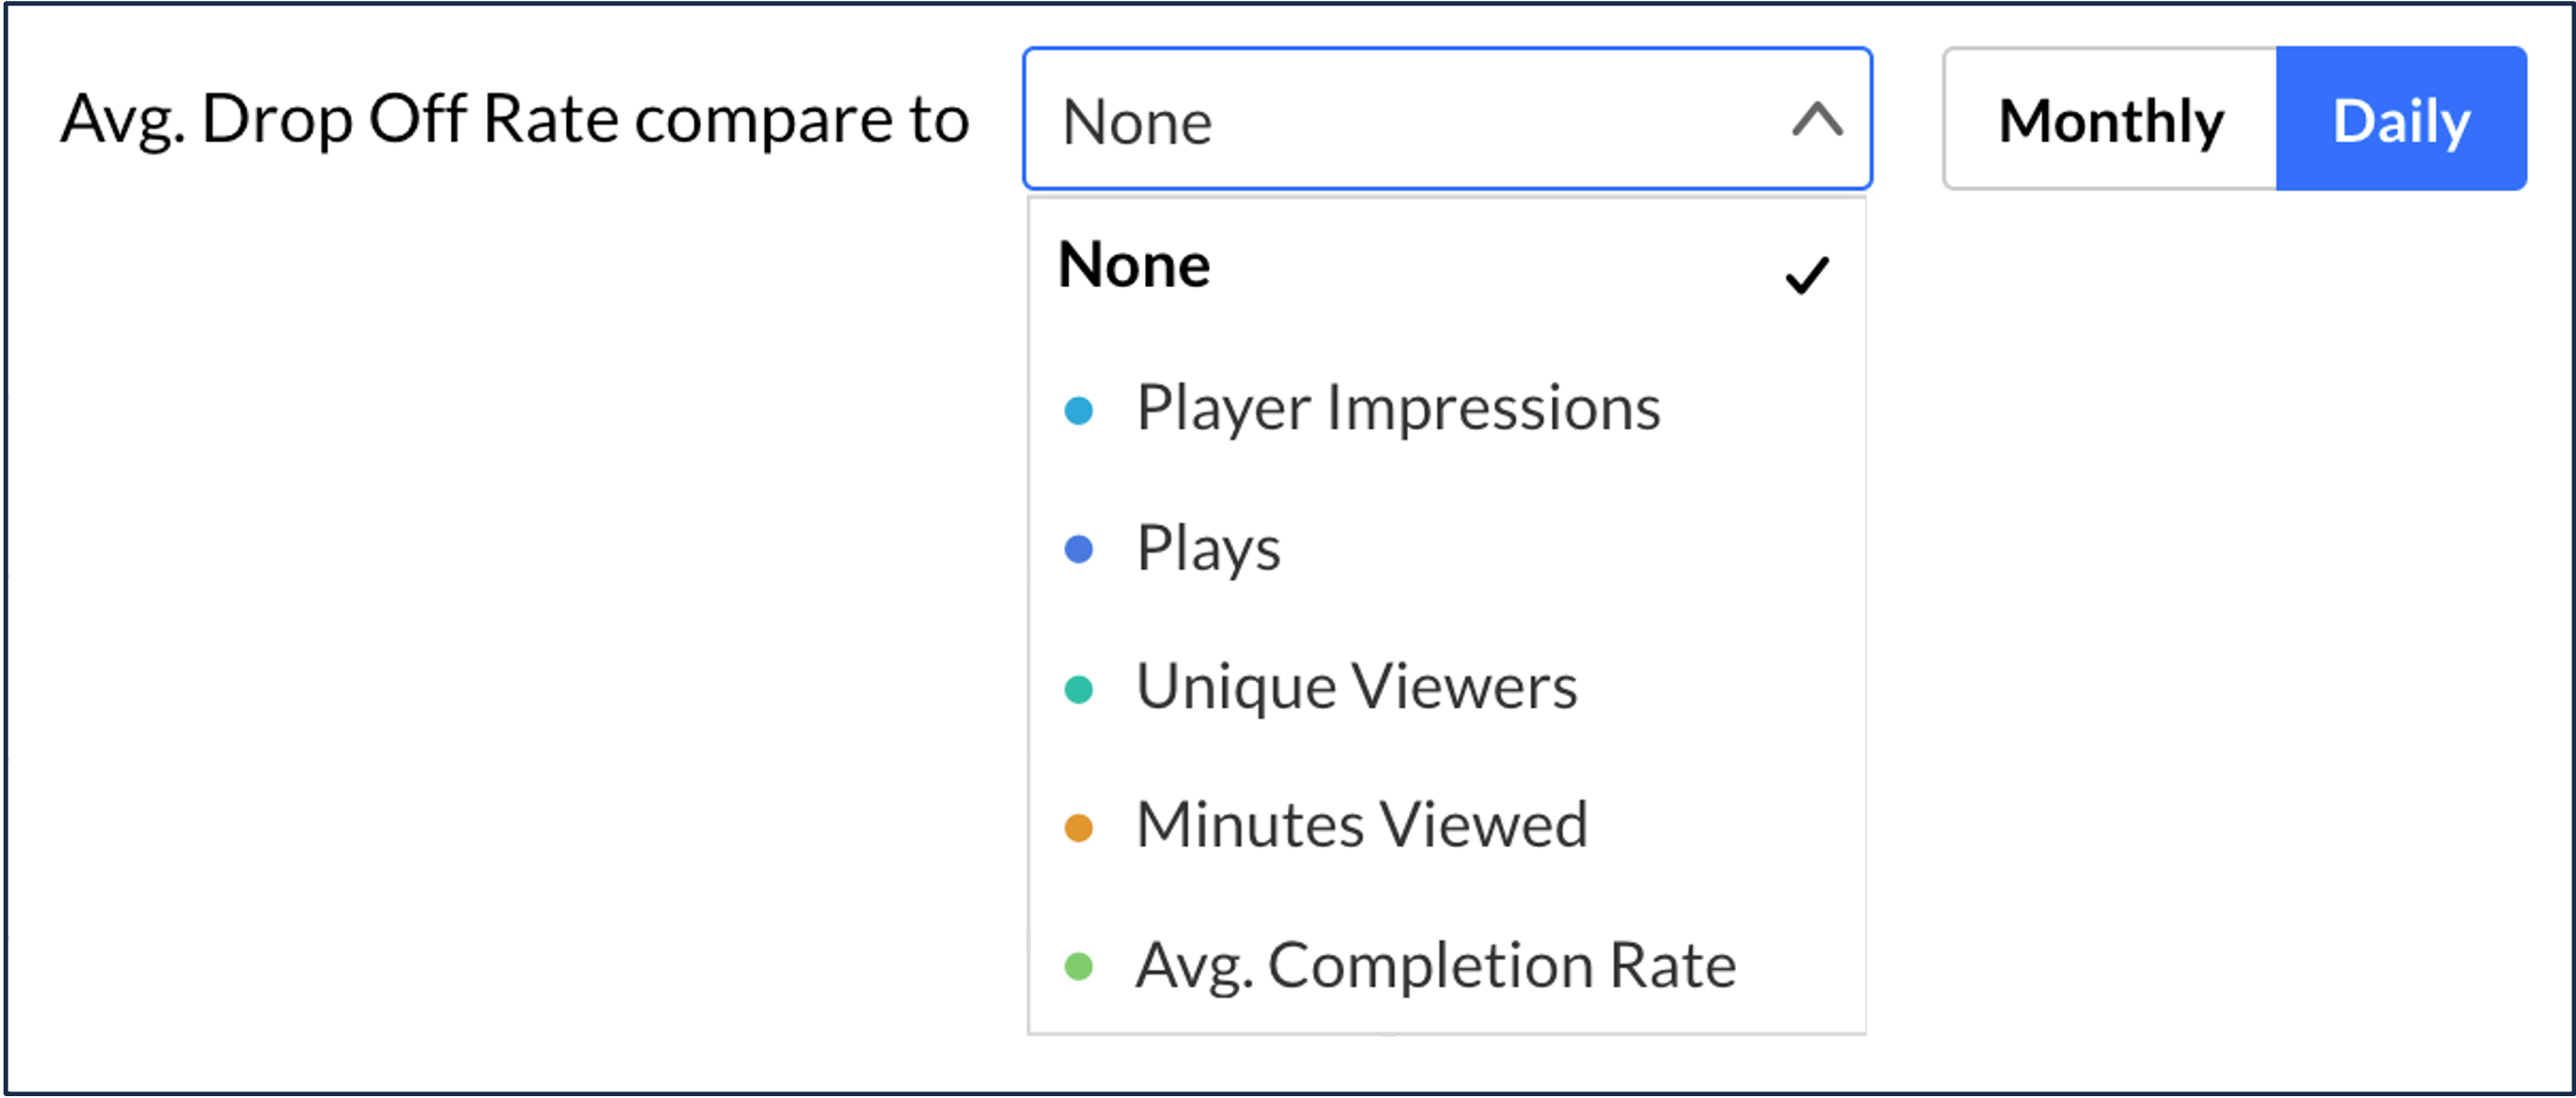
The "video performance over time" allows you to choose which metric you want to see mapped over the time period you identify at the top of the analytics page. Each needs a little explanation.
| Metric | Definition | Notes | Question it Addresses |
|---|---|---|---|
| Player impressions | The number of times the video was loaded on a page, calculated on a daily basis | Impressions don't account for whether or not the user played the video. | On a daily basis during the selected date range, how many times did someone come to a page with this video on it? |
| Plays | The number of times the play button was hit, calculated on a daily basis | It doesn't relate to how much of the video they watched. Users could have pressed play and then immediately paused the video or closed the window. | On a daily basis during the selected date range, how many times did users click play on this video? |
| Unique viewers | The number of authenticated viewers who watched the video, calculated on a daily basis | If you're only presenting your video in Canvas, chances are that most or all of your viewers will be unique/authenticated. All unauthenticated views will be tracked under the user moniker "Unknown." | On a daily basis during the selected date range, how many students watched this video in Canvas? |
| Minutes viewed | The number of minutes of the video were consumed, cumulatively from all viewers, calculated on a daily basis | Across all viewers within the selected date range, how many minutes of the video were viewed, on a daily basis? | |
| Avg. completion rate | What percentage of the video was completed, averaged across all users; calculated on a daily basis | Example: A student watched the video twice. The first time she watched 20% of it, and the second time she watched 80% of it. Her average completion rate would be (20+80) ➗2 plays = 50%. | On average, how much of the video was watched on a particular day within the selected date range? |
| Avg. drop off rate | The average quartile of the video when users stopped watching the video, averaged across all users and calculated on a daily basis |
The "quartile" refers to which of the four parts of the video the user was watching when they stopped watching the video (the first, second, third, or fourth quarter of the video). The first quarter is treated as 0%, the second as 25%, the third as 75%, and the fourth as 100% So: Average dropoff rate = (quartile dropoff for first play + quartile dropoff for play 2, etc.) ➗ number of plays Here's an example. Let's say a student watches the first 20% of the video and then later that day watches the first 80% of the video. His average dropoff rate would calculated as follows: (0 + 75) ➗ 2 plays = 37.5% avg. drop off rate For the first view, his watch of 20% of the video means that he stopped in the first quartile, which means 0% since he didn't reach the 25% "milestone." His second view (80%) is represented in the calculation as 75%, since he passed the 3rd quartile milestone. All users' daily average drop off rates are then themselves averaged to get the final figure. |
On average, how much of the video did users watch on a daily basis? |
You may elect to view the graph calculated with monthly data points or daily data points. You can also elect to compare two metrics by using the pull
Details
If you click "view details" beneath the "video performance over time" graph, you can see specific metrics based on three selectable criteria, all within the date range you identified at the top of the page:
- Dates: metrics for each day of the date range, namely player impressions, plays, unique viewers, minutes viewed, average completion rate, and average dropoff rate.
- Users: metrics for each user who viewed the video within the date range, namely player impressions, plays, minutes viewed, average completion rate, average dropoff rate, and total completion rate.
- Playback context: metrics based on where/how the video was viewed (for example, within your Canvas course, on an external webpage, etc.). This metric may only be of interest if you have the video published or embedded in multiple courses. You may see 5-digit numbers listed in the "name" column - these refer to the course number that's affiliated with your course in Canvas. For example, the URL for your Canvas course might be https://canvas.ucsd.edu/courses/12345/; if you published a video to that course, one of the playback contexts for that video would be "12345."
The Engagement Funnel
The so-called "engagement funnel" attempts to illustrate the relationship between the number of times someone landed on a page with your video on it ("player impressions") and the percentage of video completion. Users can select completion quartiles in a pull-down menu towards the bottom of the illustration.
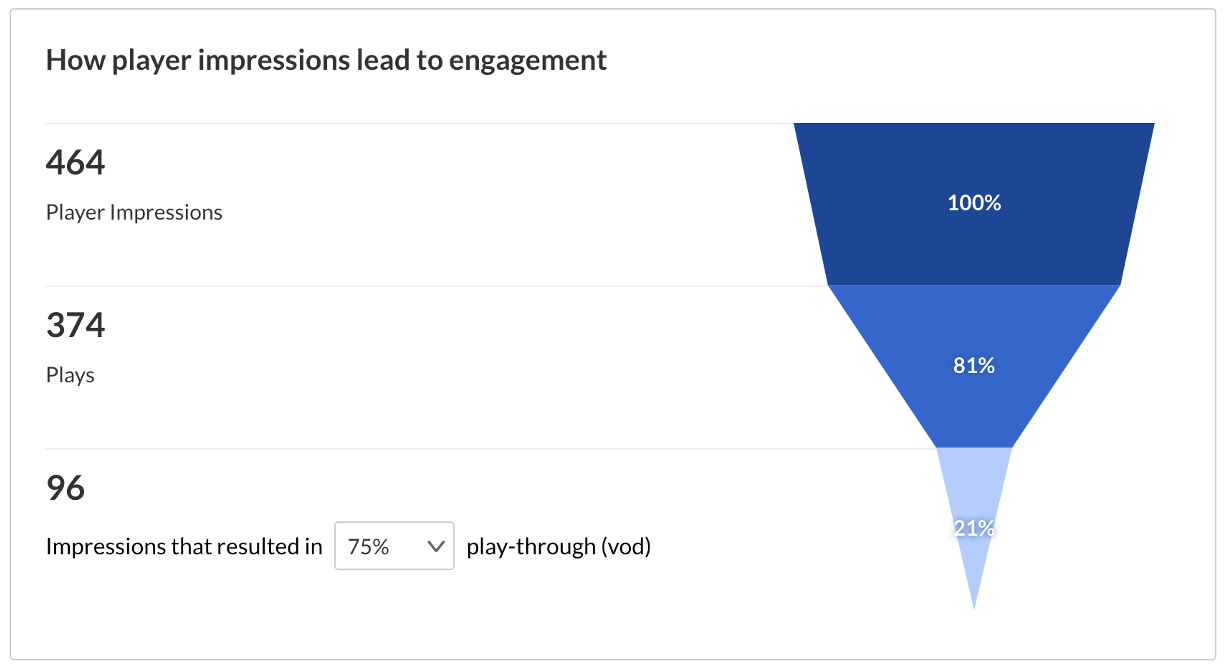
Admittedly the engagement funnel is a visual representation that may be more useful in a marketing capacity. In a way, it tells you a "conversion rate": how many people who saw the video player actually watched it, and how much of it. It might give you clues about ways to entice users to click "play," or make creative decisions about affecting the video length or content to improve the play-through rate.
Metric Definitions
There are only a couple of metrics used in the engagement funnel.
| Metric | Definition | Notes | Question it Addresses |
|---|---|---|---|
| Player impressions | The number of times the video was loaded on a page, calculated on a daily basis | The number is irrespective of whether or not they clicked "play." | How many times did someone come to a page with this video on it? |
| Plays | The number of times the play button was hit, calculated on a daily basis | It doesn't relate to how much of the video they watched. The user could have pressed play and then immediately paused the video or closed the window. | How many times did users click play on this video? |
At the bottom of the visual representation there's a pull-down menu that allows you to select a quartile.
- 25% refers to users who watched at least 25% of the video.
- 50% refers to users who watched at least 50% of the video.
- 75% refers to users who watched at least 75% of the video.
- 100% refers to anyone who watched the entire video.
Top Countries
The "top countries" section of Kaltura video analytics tells you from which countries your video has been watched, based on player impressions (the number of times the video's page was loaded in a browser).
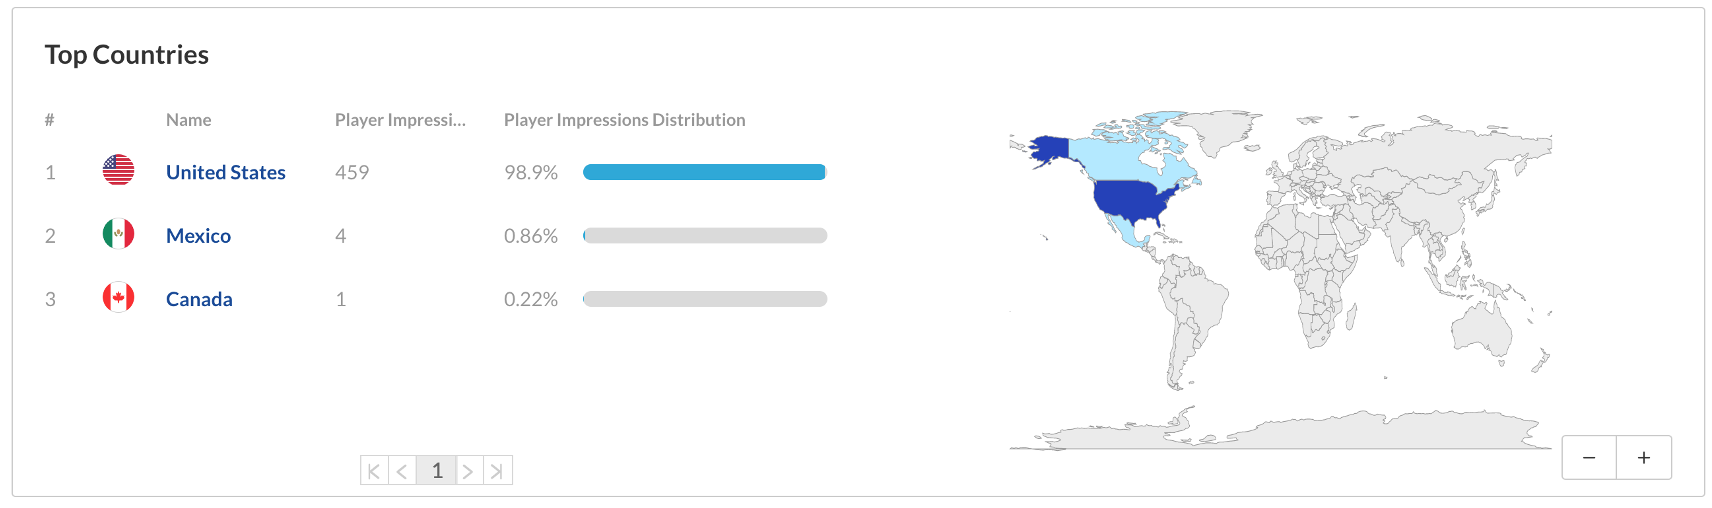
Particularly if you're teaching an online course, this might paint an interesting picture of how your students are distributed throughout the world.
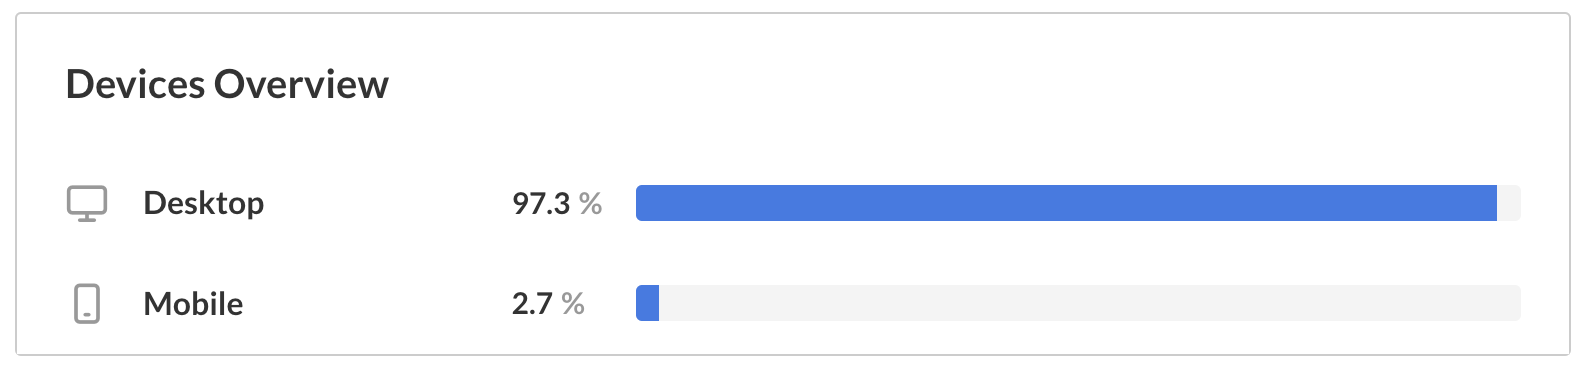
Devices Overview
This section of the analytics tells you what devices students are using to consume your multimedia. This is based on plays, not impressions.
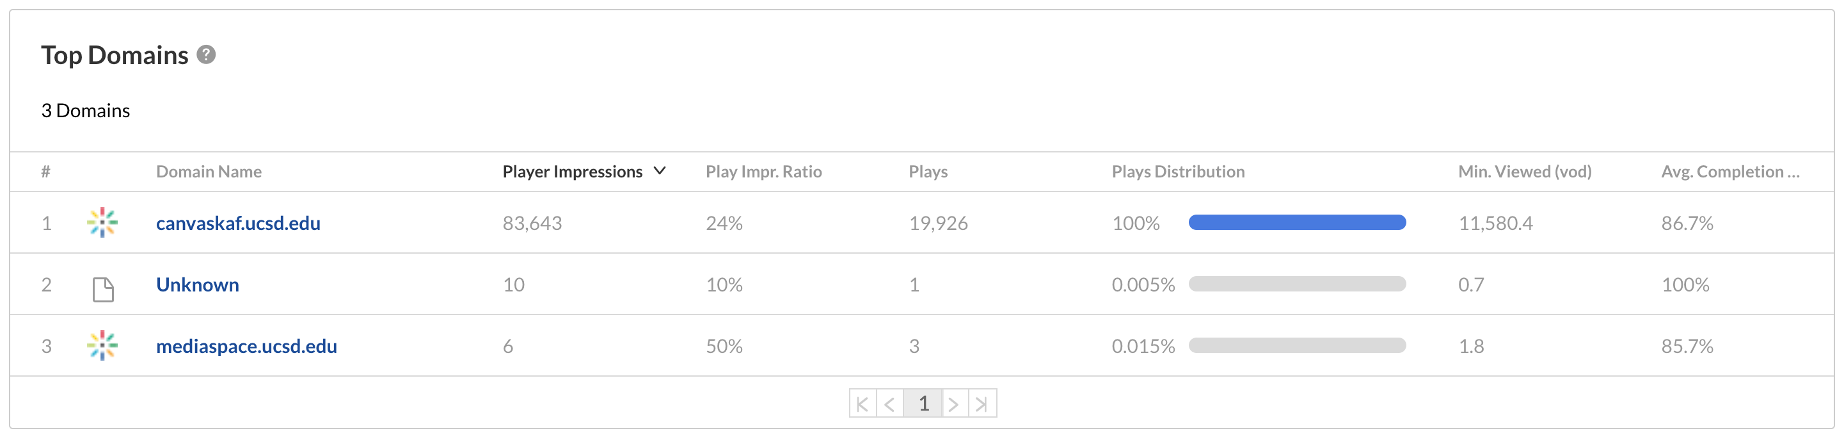
Top Domains
"Top domains" refers to where on the Internet your students are consuming your video, such as Canvas, or any external website.
If your video is exclusively presented within Canvas, chances are there won't be much of interest to see here. ("Canvaskaf.ucsd.edu" refers to a video being presented within Canvas.) But if your video is presented in multiple places - for example, published to a Canvas course, visible in a MediaSpace channel, embedded on a webpage, etc. - then it may be interesting to see where most of the traffic is coming from.
Note that depending on how you've distributed your video, some of the information may be difficult to decipher, and entirely unique to your publication situation.
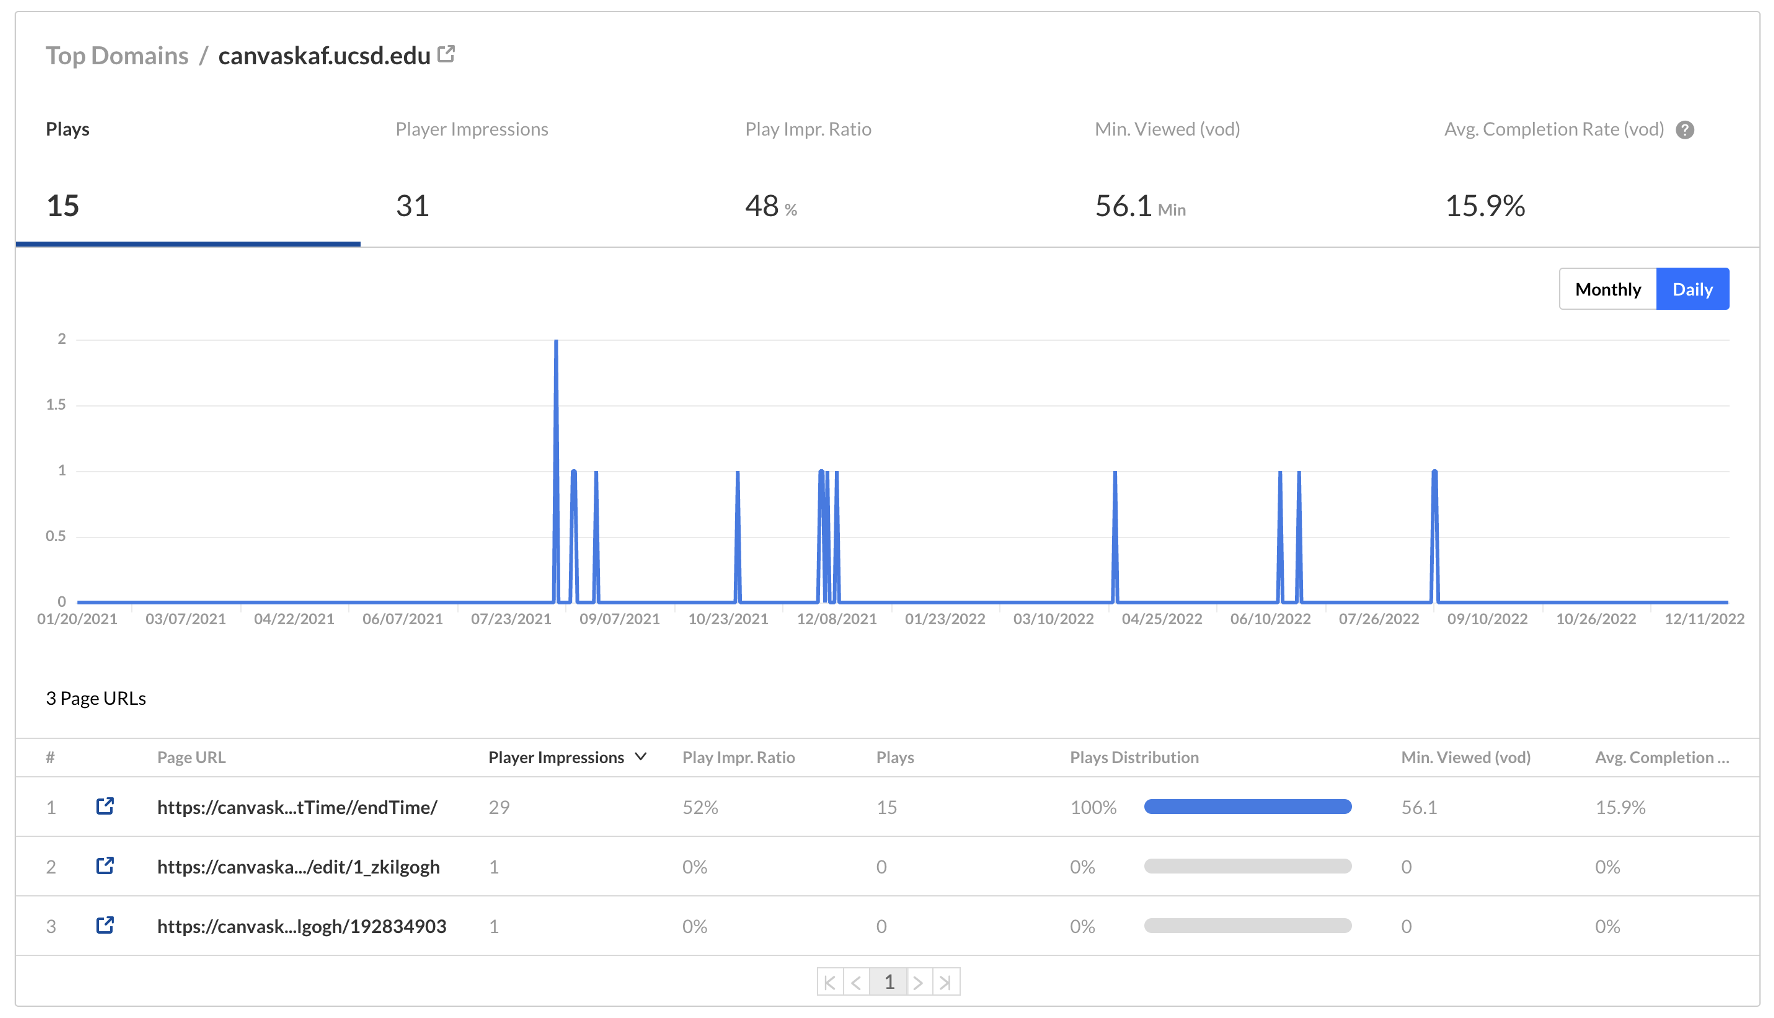
Domain-Specific Analytics
You're able to click any domain in your list of top domains and drill into some data specific to that domain. When looking at specific domain URLs, you're shown two main sets of data.
The Graph
The graph shown is comparable to the "video performance over time" graph elsewhere on the analytics page You can elect to view plays, player impressions, player impression ratio, minutes viewed, or average completion rate over the time period you selected at the top of the page.
Page URLs
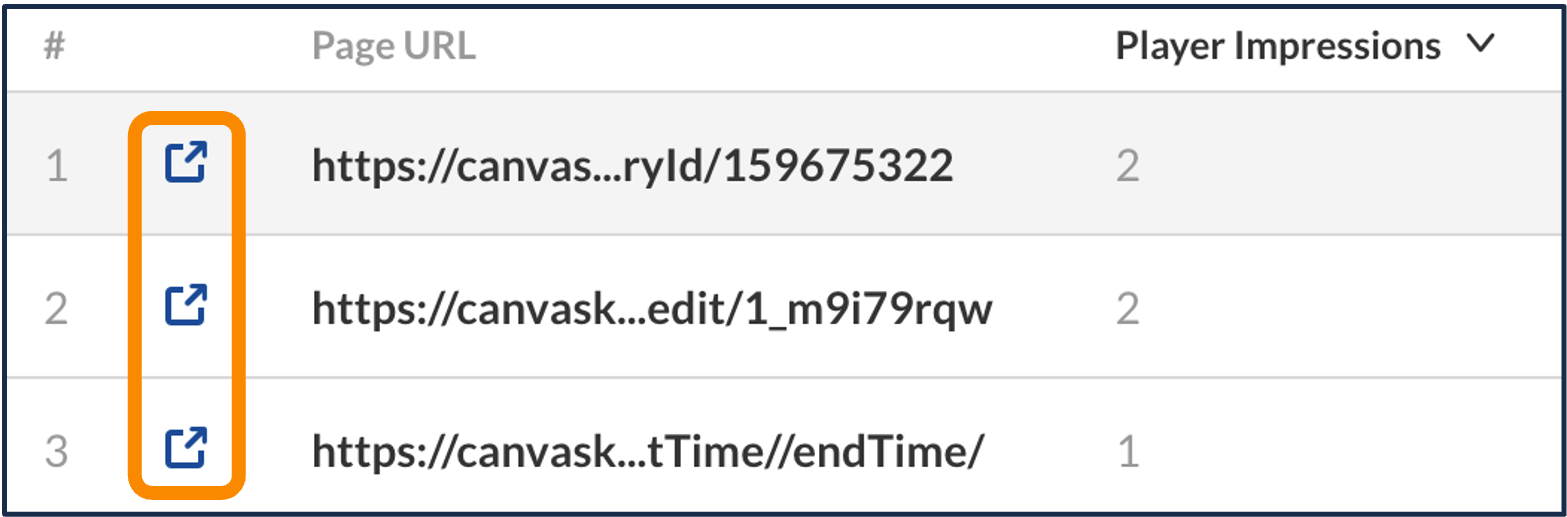 In addition, you'll be shown various URLs within that domain where the video has been loaded, which may provide some additional clarity on and granularity to the graph above. Icons on each URL's row allow you to visit the webpage, which can be handy in determining where, specifically, people are watching your video.
Note that sometimes the URLs might be a little wonky or not work. Sometimes they refer to a video player that appears in a pop-up window when you're, say, configuring an embedded video. Or perhaps a co-publisher you added to your video published it in his own course, to which you don't have access.
Metric Definitions
The metrics in the "top domains" section may be familiar to you if you've looked at other analytics sections.
| Metric | Definition | Notes | Question it Addresses |
|---|---|---|---|
| Player impressions | The number of times the video was loaded on a page in the selected domain | "Player impressions" doesn't account for whether or not the user played the video. | Within this domain, how many times did someone come to a page with this video on it? |
| Player Impr. Ratio | The number of times the play button was clicked divided by the number of impressions | Short for "player impressions ratio." This number gives you an impression of how many people were interested enough in your video to click play when they landed on its page. | Within this domain, what proportion of users who arrived at the page actually clicked play? |
| Plays | The number of times the play button was hit in the selected domain | It doesn't relate to how much of the video they watched. Users could have pressed play and then immediately paused the video or closed the window. | Within this domain, how many times did users click play on this video? |
| Plays distribution | The number of plays with the selected domain divided by the total number of plays across all domains | This can give you an idea of what domain is getting the most views. | What proportion of viewers is coming from this domain? |
| Min. viewed (vod) | The total number of minutes of video viewed on that domain | "VOD" stands for "video on demand." This distinction isn't meaningful to us since we don't use any of Kaltura's synchronous features (e.g. Kaltura Live). | How many minutes of video were viewed on this domain? |
| Avg. completion rate | How much of the video was watched | If you've got your video posted on multiple domains, this could provide insight as to where viewers are more likely to watch more of your video. | On average, what percentage of the video did viewers watch on this domain? |
Filter and Export Functions
Kaltura allows you to filter your analytics search and export the results. These options are available at the top of the page.
Filtering
The filtering options are fairly limited and straightforward. In addition to being able to select the date range for your analytics data, you're able to filter by the following criteria:
- Countries: restricts your dataset to countries that you select.
- Domains: restricts your dataset to particular domains where your video was viewed.
- Page URLs: only available if you have your video on multiple pages within a domain. Restricts your dataset to a particular page/URL.
Be sure to click "Apply" in order for your filter settings to take effect.
Exporting
If you click the "export" pull-down menu at the top of the analytics page, you'll have the option to export one or more reports from this video's analytics, including:
- User engagement
- Video performance
- Impressions
- Top countries
- Devices overview
- Top domains
Once you click "Export Reports," the system will send you an email that will contain links to each report you've selected. The files will be comma separated text files, with the extension .csv.
Though these .csv reports can be viewed with any text editor, they are much more legible within Microsoft Excel. If you want to edit or manipulate the exported reports, it's highly recommended that you save the .csv file as an Excel file first.
Have additional questions about video? Contact Multimedia Services at kaltura@ucsd.edu.