Course-Level Video Analytics
Aggregate data on the videos in your Canvas course can yield instructional insights.
In addition to providing analytics on individual videos, Kaltura also offers what they call "channel analytics," which apply to all videos that have been published to or embedded in your Canvas course. They can provide valuable insight into the effectiveness of your multimedia teaching materials, but Kaltura's terminology isn't always intuitive. So it's important to understand what the metrics mean.
In this tutorial, we'll try to address all the various sections or "widgets" of data in the media gallery analytics:
- Highlights
- Category page views
- Top videos
- Top viewers
- Insights
- Category performance over time
- Top countries
- Devices overview
- Top domains
If you're familiar with Kaltura's analytics for individual videos, you may recognize a lot of the same information.
The "Category Page Views" Filter
As you'll learn below, one of the sections within course-level Kaltura analytics is called "Category Page Views," and within that section there's a "filter" link. If you click that link the entire dataset for your analytics will change. While you can read more about this in the appropriate drawer below, here's a quick summary:
- With the "Category Page Views" filter off (the default): the analytics data will be for all the videos that are used within this course (whether published or embedded), but the view data will be taken from WHEREVER the video is visible outside the course as well. So if you've used the video in other courses or embedded it on an external webpage, the analytics data you see here will include view data from outside the course.
- With the "Category Page Views" filter on: you'll be looking at view data ONLY within this Canvas course.
How to View Course-Level Video Analytics
 To make use of course-level video analytics, you need to know where to find them.
- Within Canvas, enter the course in question.
- Click on "Media Gallery" in the course navigation.
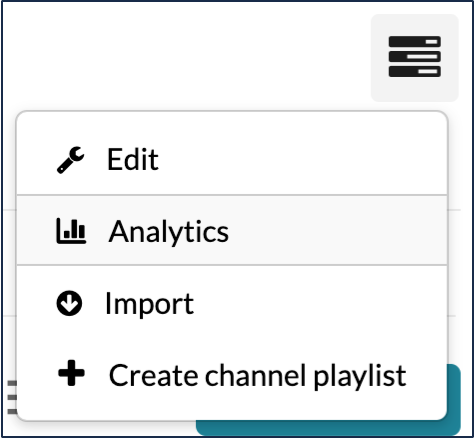
- Near the top of the page, click the icon that looks like three horizontal lines and select "Analytics." (If you hover your mouse over the icon for a moment it will say "Channel Actions.")
- Set your date range for the desired analytics using the date pickers at the top of the page.
Highlights
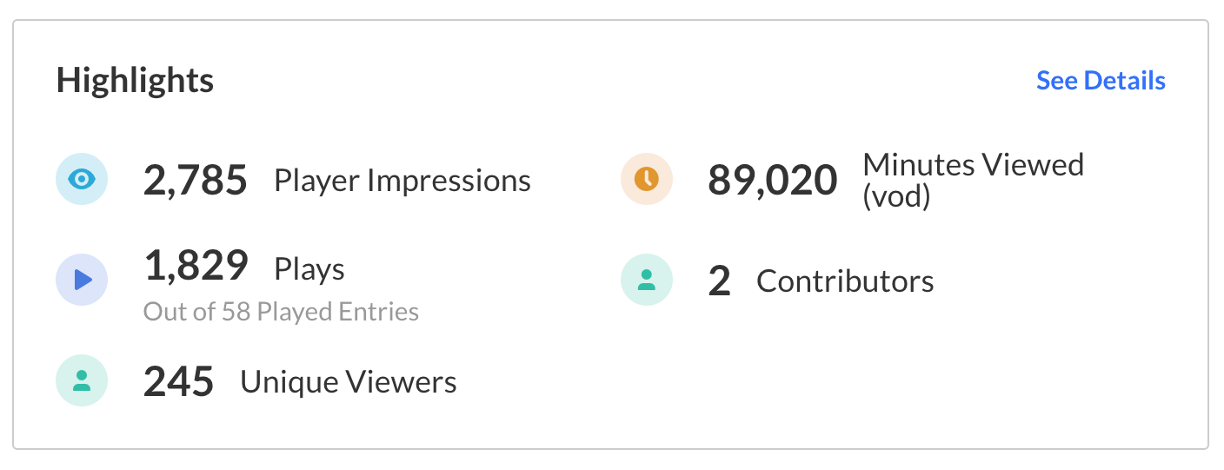
The "Highlights" section of Media Gallery analytics give you a snapshot of what Kaltura believes is interesting high-level data, such as the number of player impressions, the number of plays (out of the number of played entries), the number of unique viewers, the number of minutes viewed, and the number of contributors.
 Metric Definitions
| Metric | Definition | Notes | Question it Addresses |
|---|---|---|---|
| Player impressions | How many times the video was loaded on a page | The number is irrespective of whether or not any user clicked "play." | How many times did students arrive on webpages with this course's videos on it? |
| Plays | The number of times the play button was hit | It doesn't relate to how much of the video a user watched. They could have pressed play and then immediately paused the video or closed the window. | How many times did students click play on videos in this course? |
| Unique viewers | The number of authenticated viewers who watched course videos | If you're only presenting your video in Canvas, chances are that most or all of your viewers will be unique/authenticated. All unauthenticated views will be tracked under the single user moniker "Unknown." | How many students watched these videos? |
| Minutes viewed (vod) | The number of total minutes of video that were consumed, across all videos in the course | How many minutes of video were consumed by all users? | |
| Contributors | The number of unique users that published or embedded videos in the course | This could include students who, say, embedded a video in a discussion forum post. |
Details
Clicking "See Details" within the "Highlights" widget will jump you down the page to the section called "Category Performance Over Time." You can read more about that section later in this tutorial.
Category Page Views
A "category page" refers to any page in your Canvas course where videos can be played. (Kaltura considers a course to be a "category" on the back end.) A category page could be in the Media Gallery or on individual Canvas pages if you embedded videos within your modules.
 The "Category Page Views" Filter
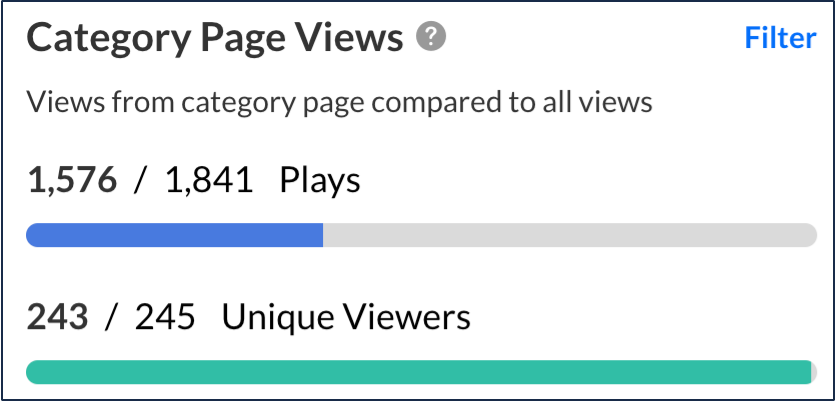
You may also have noticed a small "Filter" link at the top right of this section. If you click it, the "Category Page Views" section will disappear and the dataset for the entire analytics page will change.
Whether the filter is on or off, the "Category Page Views" widget will show analytics data for all the videos that are used in this particular Canvas course. However, if the filter is off (the default when you arrive at the Media Gallery analytics page), the analytics shown throughout in other widgets on the page will represent analytics for all the videos regardless of where they're posted. So if you've posted the videos in this course elsewhere (such as in another course, embedded on an external website, or in a MediaSpace channel), the analytics will include viewing data from those other places as well. If you turn the filter on, you will see data ONLY for when the video was viewed within this particular Canvas course.
The "Category Performance Over Time" graph will behave a little differently. By default, the graph will show the performance of your videos, irrespective of whether they were watched within your Canvas course or elsewhere, but if you click the filter link, you'll also see a dotted line on the graph that represents JUST the performance within your Canvas course.
Metric Definitions
| Metric | Definition | Notes | Question it Addresses |
|---|---|---|---|
| Plays | The number of times the play button was hit | It doesn't relate to how much of the video a user watched. They could have pressed play and then immediately paused the video or closed the window. | How many times did students click play on videos in this course? |
| Unique viewers | The number of authenticated viewers who watched course videos | If you're only presenting your video in Canvas, chances are that most or all of your viewers will be unique/authenticated. All unauthenticated views will be tracked under the single user moniker "Unknown." | How many students watched these videos? |
The "Top Videos" Widget
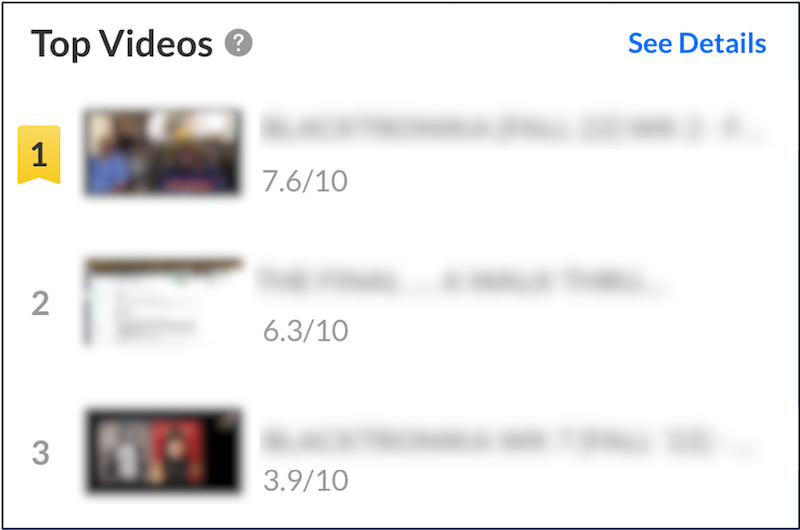
There are actually two "Top Videos" sections in the Media Gallery analytics. The first one (which we're referring to as a "widget") is near the top of the page and shows the top 3 videos based on Kaltura's "engagement formula." If you click "See Details" within the widget, you'll jump down to the "Top Videos" section lower on the page, which contains more information and some of the metrics that contribute to this formula.
The "engagement formula," represented with a score out of 10, examines the number of plays, unique viewers, and the dropoff rate, assigning a different weight to each. (Note that Kaltura has so far refused to provide specifics on how this number is calculated.) Read the drawer about the Top Videos section below to learn more about the engagement formula.
Top Viewers
The "Top Viewers" section ranks users based on their number of plays. Remember, though, that plays refers to the number of times that the "play" button was clicked and doesn't take into account how much of any video the user consumed.
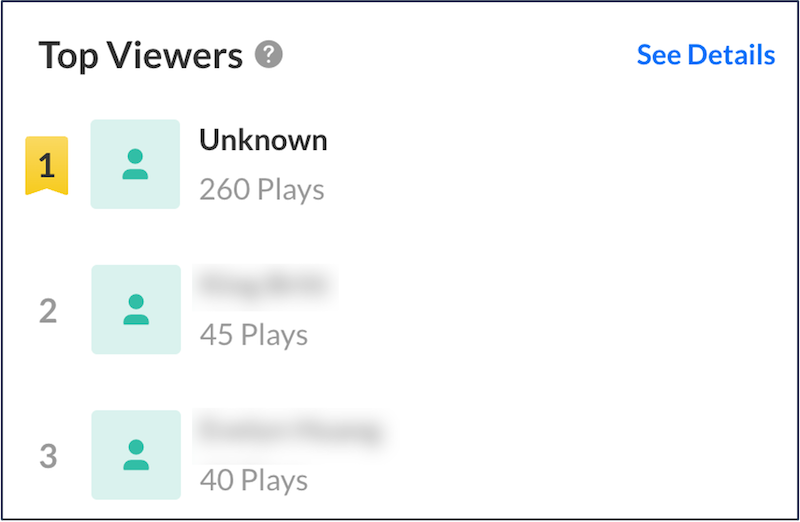 As pictured in the screenshot, you may see a user in your top viewers labeled "Unknown." While Kaltura can identify most users in Canvas and MediaSpace based on their login information, if you make a video public (by leveraging MediaSpace to embed it on an external webpage, for example), Kaltura won't know who is watching a video but will still log that anonymous user's viewing activity.
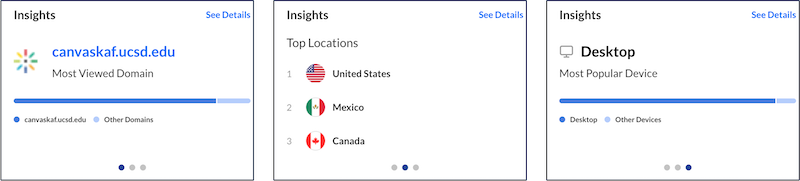
The "Insights" Carousel
The "Insights" section will cycle between three datasets:
- The most popular domain (web location) where your video was consumed
- The top countries where your video was consumed
- The most popular device used to consume your videos
Clicking "See Details" when any of these three datasets are visible will jump you down to a more detailed section of that information. Jump the appropriate drawer below to learn more about the metrics.
The "Category Performance Over Time" Graph
This section of the Media Gallery analytics provides a visual representation of a variety of metrics over time: player impressions, plays, unique viewers, minutes viewed, average drop off rate, and average completion rate.
By default, the graph will display data based on ALL views of videos that are within your course. So if you've posted your video anywhere else (another course, on an external website, etc.), the data shown here will include those views. If you want to see the performance of the course's videos solely within this course, scroll up to the "category page views" widget and click "filter." A dotted line will be added to the graph that represents the data of the videos just within the course.
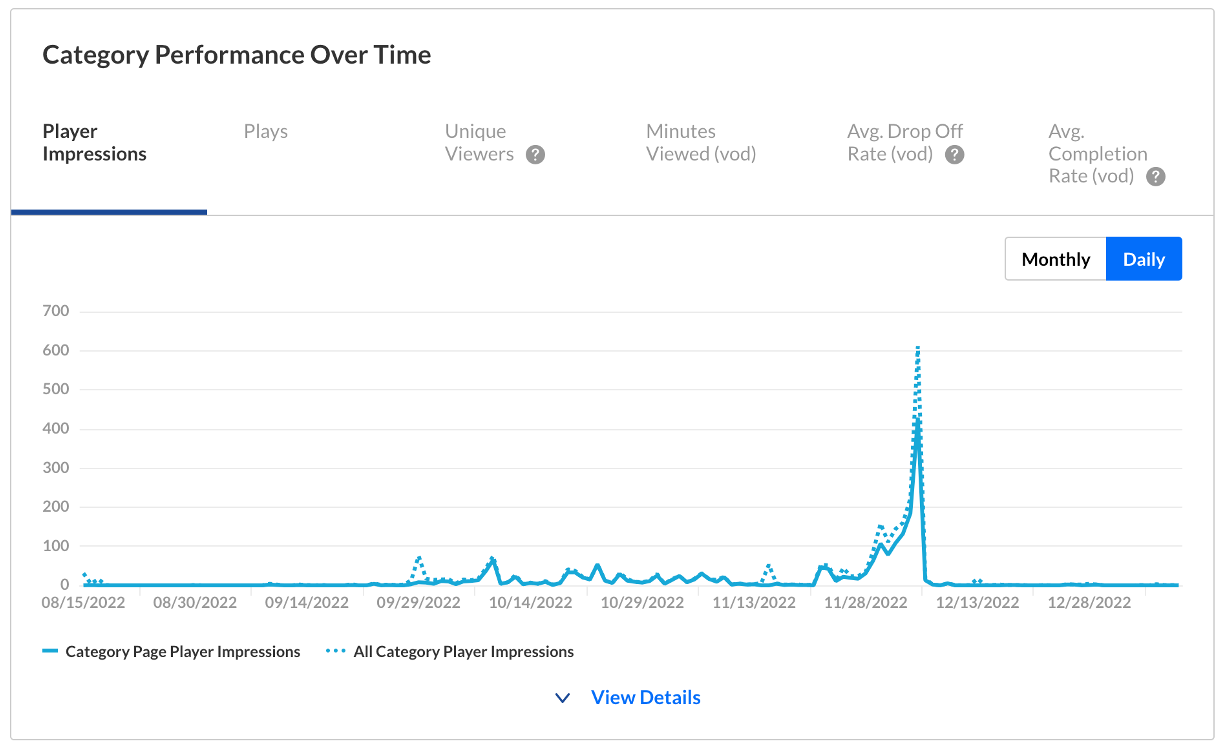
Clicking "view details" below the graph allows you to look at aggregate data by user, entry (i.e. video), and date.
Metric Definitions
| Metric | Definition | Notes | Question it Addresses |
|---|---|---|---|
| Player impressions | The number of times the video was loaded on a page | Impressions don't account for whether or not the user played the video. | Over time, how many times did someone come to pages with any of these videos on them? |
| Plays | The number of times the play button was clicked for any videos | It doesn't relate to how much of the video they watched. Users could have pressed play and then immediately paused the video or closed the window. | How many times did users click play on these videos? |
| Unique viewers | The number of authenticated viewers who watched any of the videos | If you're only presenting your video in Canvas, chances are that most or all of your viewers will be unique/authenticated. All unauthenticated views will be tracked together under the moniker "Unknown." | How many separate users watched these videos? |
| Minutes viewed (category page views filter off) | The number of minutes of video that were consumed, cumulatively from all viewers | Across all viewers and videos, how many minutes were watched on a daily basis? | |
| Avg. drop off rate | The average quartile of the videos when users stopped watching the videos, averaged across all users and videos and calculated on a daily basis |
The "quartile" refers to which of the four parts of a video the user was watching when they stopped watching it (the first, second, third, or fourth quarter of a video). The first quarter is treated as 0%, the second as 25%, the third as 75%, and the fourth as 100% So: Average dropoff rate = (quartile dropoff for first play + quartile dropoff for play 2, etc.) ➗ number of plays Here's an example. Let's say a student watches the first 20% of the video and then later that day watches the first 80% of the video. His average dropoff rate would calculated as follows: (0 + 75) ➗ 2 plays = 37.5% avg. drop off rate For the first view, his watch of 20% of the video means that he stopped in the first quartile, which means 0% since he didn't reach the 25% "milestone." His second view (80%) is represented in the calculation as 75%, since he passed the 3rd quartile milestone. All users' daily average drop off rates are then themselves averaged across all views to get the final figure. |
On average, how much of the videos did users watch on a daily basis? |
| Avg. completion rate | How much of each video users viewed, averaged across all users and calculated on a daily basis | Example: A student watched the video twice. The first time she watched 20% of it, and the second time she watched 80% of it. Her average completion rate would be (20+80) ➗ 2 plays = 50%. | Over time, about how much of each video did users complete per viewing session? |
Top Videos
The top video section provides more detailed data than the widget near the top of the analytics page. Here you can learn more about the most popular videos in the course. The first three metrics shown (plays, unique viewers, and average completion rate) are used to calculate the formula for each video's "score."
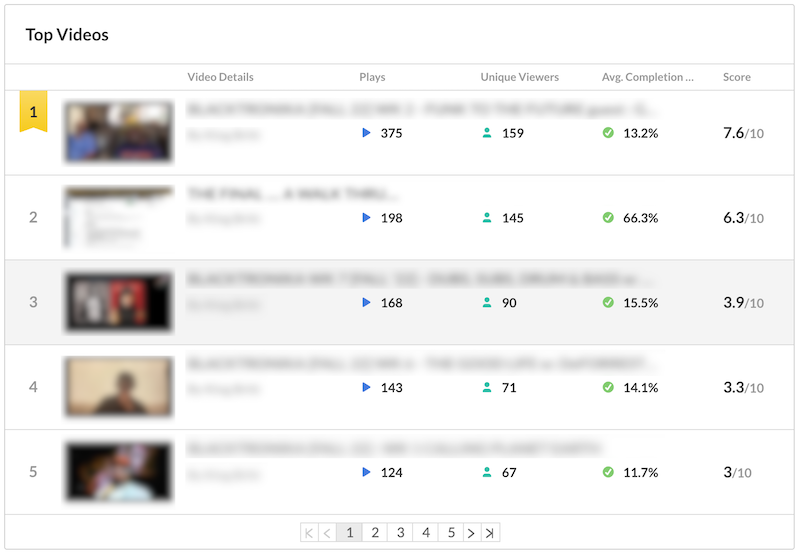 Note that you can use the numbers and arrow at the bottom of this section to advance through all of the videos.
Metric Definitions
| Metric | Definition | Notes | Question it Addresses |
|---|---|---|---|
| Plays | The number of times the play button was clicked for any videos | It doesn't relate to how much of the video they watched. Users could have pressed play and then immediately paused the video or closed the window. | How many times did students click play on these videos? |
| Unique viewers | The number of authenticated viewers who watched any of the videos | If you're only presenting your video in Canvas, chances are that most or all of your viewers will be unique/authenticated. All unauthenticated views will be tracked together under the moniker "Unknown." | How many individual students watched these videos? |
| Avg. completion rate | How much of each video users viewed, averaged across all users and calculated on a daily basis | Example: A student watched the video twice. The first time she watched 20% of it, and the second time she watched 80% of it. Her average completion rate would be (20+80) ➗ 2 plays = 50%. | Over time, about how much of each video did viewers complete per viewing session? |
| Score | A measure of how engaging a video is | Kaltura has so far refused to provide specifics on how this metric is calculated. According to their documentation: "How do you measure a top engaging video? Is it the most number of plays? How many users watched it? Is it the drop-off rate? In reality, it's not one thing, but the combination of all of the above. So we took into account these 3 metrics and created an engagement formula. It assigns a different weight to each metric and normalizes the score across your data." | On a scale of 1-10, how engaging was this video compared to others in the course? |
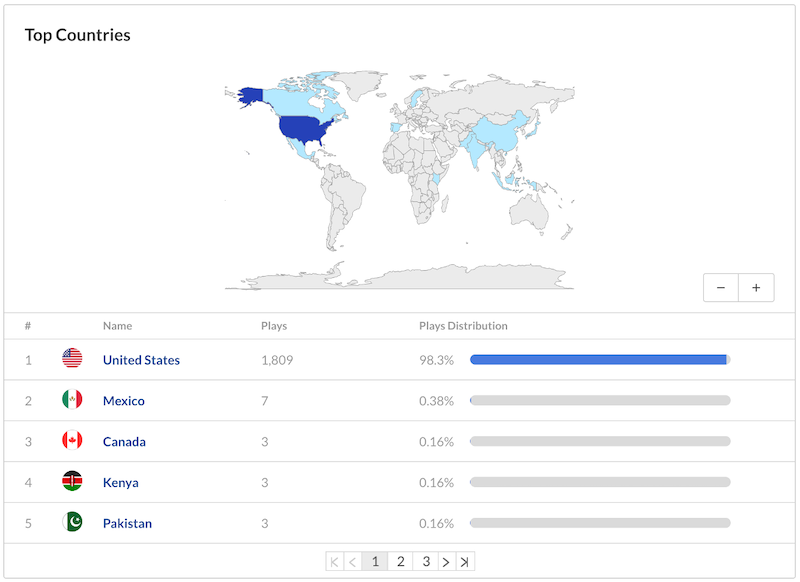
Top Countries
Here you can see the countries in which your viewers are located. This section also includes a map that allows you to zoom in and out using the plus and minus buttons. You can use the numbers and arrows at the bottom of the section to advance through all of the results.
You can also click each country and drill down into the regions and cities where views took place!
Metric Definitions
| Metric | Definition | Notes | Question it Addresses |
|---|---|---|---|
| Plays | The number of times the play button was hit | It doesn't relate to how much of the video a user watched. They could have pressed play and then immediately paused the video or closed the window. | How many times did viewers in this country click play on this video? |
| Plays distribution | The number of plays with the selected country divided by the total number of plays across all countries | This can give you an idea of the country from where most of your views are coming. | What proportion of viewers are in this country? |
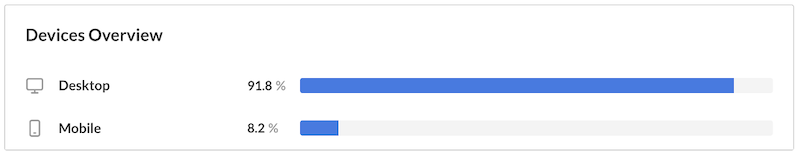
Devices Overview
This section of the analytics tells you what devices were used to consume your videos, and in what relative proportions. Possible devices include computers, mobile devices, tablets, media receivers, and even game consoles.
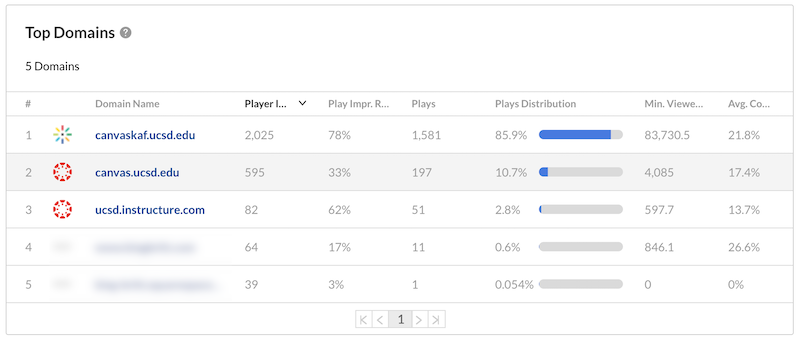
Top Domains
"Top domains" refers to where on the Internet your students are consuming your video, such as Canvas or any external website.
If your video is exclusively presented within Canvas, chances are there won't be much of interest to see here. ("Canvaskaf.ucsd.edu" refers to a video being presented within Canvas.) But if your video is presented in multiple places - for example, published to a Canvas course, visible in a MediaSpace channel, embedded on a webpage, etc. - then it may be interesting to see where most of the traffic is coming from.
Domain-Specific Analytics
You're able to click any domain in your list of top domains and drill into some data specific to that domain. When looking at specific domain URLs, you're shown two main sets of data.
The Graph
The graph shown is comparable to the "category performance over time" graph elsewhere on the analytics page. You can elect to view plays, player impressions, player impression ratio, minutes viewed, or average completion rate over the time period you selected at the top of the page.
Page URLs
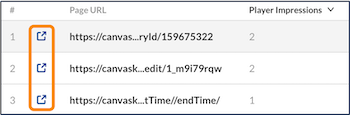 In addition, you'll be shown various URLs within that domain where the video has been loaded, which may provide some additional clarity on and granularity to the graph above. Icons on each URL's row allow you to visit the webpage, which can be handy in determining where, specifically, people are watching your video.
Note that sometimes the URLs might be a little wonky or not work. Sometimes they refer to a video player that appears in a pop-up window when you're, say, configuring an embedded video. Or perhaps a co-publisher you added to your video published it in his own course, to which you don't have access.
Metric Definitions
The metrics in the "top domains" section may be familiar to you if you've looked at other analytics sections.
| Metric | Definition | Notes | Question it Addresses |
|---|---|---|---|
| Player impressions | The number of times videos were loaded on pages in the selected domain | "Player impressions" doesn't account for whether or not the user played the video. | Within this domain, how many times did someone come to a page with one of these videos on it? |
| Player Impr. Ratio | The number of times the play button was clicked divided by the number of player impressions | Short for "player impressions ratio." This number gives you an impression of how many people were interested enough in your video to click play when they landed on its page. | Within this domain, what proportion of users who arrived at a video page actually clicked play? |
| Plays | The number of times the play button was hit in the selected domain | It doesn't relate to how much of the video they watched. Users could have pressed play and then immediately paused the video or closed the window. | Within this domain, how many times did users click play on these videos? |
| Plays distribution | The number of plays with the selected domain divided by the total number of plays across all domains | This can give you an idea of what domain is getting the most views. | What proportion of plays come from this domain? |
| Min. viewed (vod) | The total number of minutes of video viewed on that domain | "VOD" stands for "video on demand." This distinction isn't meaningful to us since we don't use any of Kaltura's synchronous features (e.g. Kaltura Live). | How many minutes of video were viewed on this domain? |
| Avg. completion rate | How much of the video was watched | If you've got your videos posted on multiple domains, this could provide insight as to where viewers are more likely to watch them. | On average, what percentage of the videos did viewers watch on this domain? |
Filter and Export Functions
Kaltura allows you to filter and export your analytics data. These options are available at the top of the page.
Filtering
You have a variety of filters from which to choose.
- Media Type: filter by video, audio, or images.
- Playback Type: this filter is likely not helpful since we don't use these other features of Kaltura.
- Entry Source: refers to how the content came into Kaltura. "Capture" refers to Kaltura Capture. It's likely that only "upload" and "capture" apply to most UC San Diego Kaltura entries because of our Kaltura featureset.
- Viewing Context: a surprisingly important filter. As mentioned several times in this tutorial, by default the data shown on the Media Gallery analytics page is view data for all videos that are used in your Canvas course, but REGARDLESS of where the video was viewed. So if you've used these videos in other courses, the data shown on this page will include those viewing data as well. Selecting "Category Page Only" is the same as clicking "Filter" in the "Category Page Views" widget.
- Sub Categories: allows you to distinguish between videos published to the Media Gallery and videos embedded in your modules. If you click "Select Sub Category," a popup window will appear. Chances are that the only checkbox available will be one labeled "InContext." This is a term that Kaltura uses to identify a video that has been embedded within a page in Canvas - this hierarchical category relationship indicates that the video is assigned to your course category but is also embedded ("InContext").
- Domains: restricts your dataset to particular domains where your video was viewed.
- Page URLs: only modifiable if you've selected a domain. Restricts your dataset to a particular page/URL.
- Tags: if you've tagged any of your videos, you can filter your results based on those tags.
- Country: restricts your dataset to the countries you select.
- Region: only modifiable if you've selected a country. Restricts your dataset to the regions you select.
- City: only modifiable if you've selected a region. Restricts your dataset to the cities you select.
Be sure to click "Apply" in order for your filter settings to take effect.
Exporting
If you click the "export" pull-down menu at the top of the analytics page, you'll have the option to export one or more reports from this video's analytics, including:
- Highlights
- Top videos
- Metrics over time
- User engagement
- Media engagement
- Top countries
- Devices overview
- Top domains
You can also elect to export all the data.
Once you click "Export Reports," the system will send you an email that will contain links to each report you've selected. The files will be comma separated text files, with the extension .csv.
Though these .csv reports can be viewed with any text editor, they are much more legible within Microsoft Excel. If you want to edit or manipulate the exported reports, it's highly recommended that you save the .csv file as an Excel file first.
Have additional questions about video? Contact Multimedia Services at kaltura@ucsd.edu.