Get Started
Get started introduces you to the access, training, and resources you'll need for Student Operational Reporting.
Background
All Vetted Reports Are Published in the Business Analytics Hub (BAH)
The Business Analytics Hub (BAH) is UC San Diego's centralized, self-service reporting platform that provides access to official campus dashboards and reports. It consolidates data from multiple systems and supports a wide range of functional areas.
Where is the Data Coming From?
The data behind most Student reports on BAH comes from the Student Activity Hub (SAH). For more details about SAH, please visit the Student Activity Hub page.
Requesting Access to Student Reports
Do I need to Request Access?
Yes—all employees who need access to student reports on the Business Analytics Hub (BAH) must submit a request and complete the required training, even if they already have TritonLink access.
Your TritonLink role (via AccessLink) can help streamline the approval process, but it does not automatically grant access to BAH student reports.
Steps to Request Access
1. Complete Required Trainings
Employees must complete three trainings prior to submitting their access request form. These trainings are:
- FERPA - Confidentiality of Student Records and Privacy Rights
- Privacy at UCSD (Privacy 101 will also meet this requirement)
- UC San Diego Business Analytics Hub Fundamentals
Training completion will be verified by the access form and may require and overnight update for the data to sync.
2. Submit the Access Request Form
- Visit Business Analytics Hub and select the Student section
- Access is granted by report category - review the options to determine what you need
- Click the Request Access button at the top right of the page
- Fill out the form, select Student Operational Reporting Access in the Business Analytics Hub Report Access section
- The form will automatically route for required approvals, which may include:
- Supervisor approval
- Data steward approval
Approval routing may be expedited based on your job function and/or existing TritionLink access.
How to Run a Report
The short video below will introduce basic navigation and critical concepts for the new Student reports.
Written instructions
Step 1: Select the Report
Start by navigating to the Business Analytics Hub. Click the Student tab, then choose the report you would like to run. On BAH, you can toggle between Card View or List View depending on your preference.
Step 2: Choose Report Columns
Use the Report Fields prompt to select the fields you'd like to appear as columns in your report. This allows you to customize your report and focus on the data that's most important to you.
Step 3: Apply Filters or Search Criteria
Enter your filters or search criteria in the prompts available to narrow down the data. This could include selecting specific student information, class section or course information, or dates.
Required prompts are indicated with a red asterisk.
Some filter prompts will allow you to paste in a list of values such as a list of Student PIDs or Class Section IDs. You can paste lists directly from excel. Don’t include comas only spaces to separate values.
Other prompts will allow you to search for specific values. There are different search options available via a dropdown in the prompt box.
For date range or number range prompts, you can specify a minimum value, maximum value or both.
Step 4: Run the Report
Once you've selected your columns and entered your filters, click the Finish button either at the top or bottom of the report to generate your report. This will retrieve the data based on your criteria.
Step 5: Export to Excel
If needed, you can download to excel. We highly recommend choosing Excel not Excel Data or CSV to ensure the file only contains the columns you want. The other formats may export all available data, not just what you requested.
Step 6: Adjust Report Fields After Running
Need to fine-tune your results? Use the Hide/Show Report Fields dropdown to add or remove columns directly—no need to go back to the prompt page.
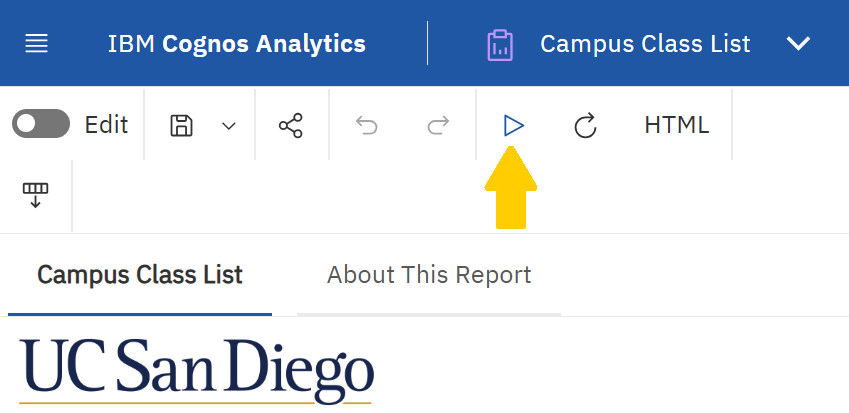
Step 7: Review or Modify Filters
Click the "About This Report" tab to view the filters that were applied to your report. If you need to modify your filters, click the Run button at the top of the page. This brings you back to the prompt screen where you can update your selections and re-run the report.
"Save As" vs "Save As Report View"
When working with reports in Cognos (via the Business Analytics Hub), you have two main options for customizing your experience: "Save As" to create a report copy or "Save As Report View". Here’s how they differ:
Report Copy ("Save As")
A Report Copy is a standalone duplicate of the original report. It behaves like its own independent report and does not stay in sync with the original (source) report.
Use a copy to develop a new custom version of the report.
⚠️Caution: Copies do not receive updates if the original report changes (e.g., logic, fields, bug fixes).
Save As Report View
A report view is a saved version of the original report that preserves a link to the source report. It allows you to:
- save your preferred prompt selections (filters, columns, etc.)
- always use the latest version of the report (auto-updates when the original is updated)
✅ Recommended for most users, especially if you just want to save your personal view or receive regular updates.
Best Practice
For most users we recommend a Report View — it’s safer, faster, and ensures you’re working with the latest approved version of the report.
Creating a Report View
You can save your prompt selections for future use. To learn how:
- Refer to the “Create a Linked Copy aka Report View” section of the “Cognos for Consumers” collab page for step-by-step instructions.
- Watch the recorded walkthrough (requires AD login).
Quick reference steps:
- Locate the report in Cognos either via folder navigation or using the search bar at the top.
- Open the report action menu using the three dots or right clicking on the report name. Select “Create a report view”.
- In the “Save as” pop-up, name your saved view, and click on “My Content” to save it in your “My Content” folder.
- Navigate to the new saved report view and set the properties. (Properties is available in the action menu by right-clicking on the report or left clicking on the 3-dots.)
- Set the prompts using the "Edit Values" or “Set values” button on the “Report” tab. When done, click the Finish button on the prompt page.
You will be required to set all required prompts including specifying a Term Code. - Set the “Prompt for values” to either:
“No” if you want the report to run without modifying the prompts in the future
“Yes” if you want to be able to modify the prompts in the future before the report runs
Tip: “Yes” is recommended as it will allow you to select the term(s) that you would like to include. - Click “Save”.
You can modify the saved prompts in the future by using the “Edit values” button on the view properties.
Training and Support
Is Training or Support Available?
Yes! We offer a range of resources to help you get the most out of student reporting tools and data.
Learning and Reference Materials
Each report category in BAH has it's own dedicated section in the left-hand menu.
Use these links to access training guides and support materials.
One-on-One Support Sessions
Need help with a specific report or have questions about student data?
You can schedule a one-on-one session with a member of the Student Operational Reporting Team for personalized support.
Office Hours
Join our weekly Office Hours for live Q&A, demos, and reporting tips.
- When: Wednesdays, 11am-12pm
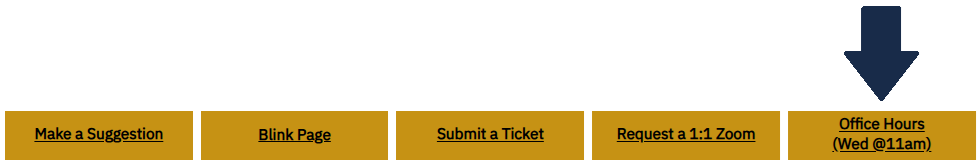
- Where: Zoom - use the Office Hours (Wed@11am) button in the report header.
Access to Student Operational Reports is required to attend.
Additional Support
For other reporting support needs, please visit the Get Help Blink page for links to broader campus resources and help options.
Tips & Tricks
Report Fields
On the prompt page as well as the report page, there is a checkbox prompt called “Report Fields”. This controls the fields (columns) that display on the report when viewed in your browser (HTML) or when downloaded to Excel.
This feature was added to replicate the Querylink option to select only the information you would like included in your report.
Note that the “Excel-data” and "CSV" output options will include ALL fields (columns) not just the selected ones. For this reason, it is recommended to use "Excel".
About This Report
Each report has an “About This Report” tab that includes information about who ran the report, when the report was generated and a summary of the prompts/filters used.
If you select a filter and do not select it to be displayed, you can see this selection and know that it is active in the "About this Report" section.
Search and Select Options
The Search and Select style prompt includes several options that make this a really powerful search tool.
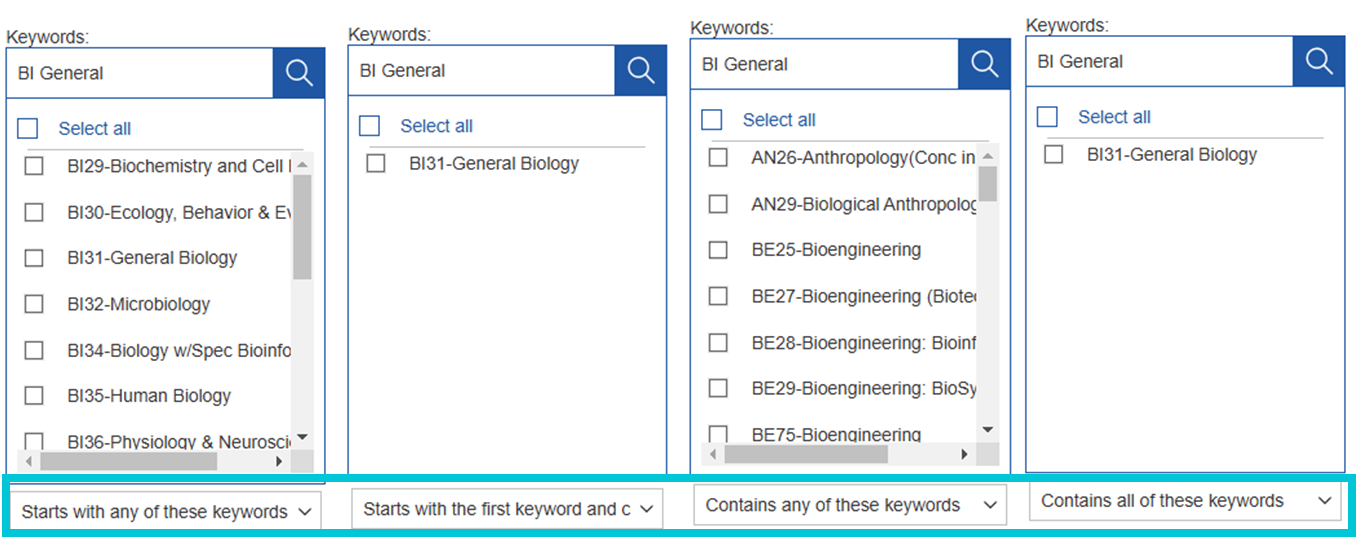
By default it will always do a “Starts with any of these keywords” search, however this can be changed to any of the following options:
- Starts with any of these keywords
- Starts with the first keyword and contains all of the remaining keywords
- Contains any of these keywords
- Contains all of these keywords
For example, if you search for “BI General” using the default “Starts with any of these keywords” many possible matches are found. The “Contains any of these keywords” will find even more options. However if you change the search type to “Starts with the first keyword and contains all of the remaining keywords” or the “Contains all of these keywords” the same search text “BI General” will find only one result.
Additional Customization of Results
Did you know, you can filter, sort or sum on any field selected in the "Report Fields" box after generating the report? The options on the prompt page are just the beginning!
For custom filtering, follow the steps below:
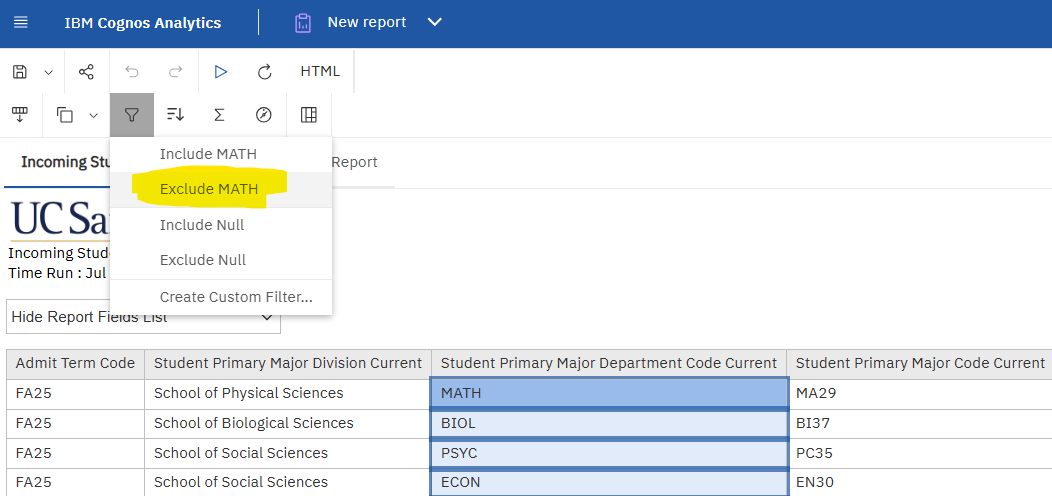
Step 1: Select the field you want to filter on, or specific value you want to include or exclude. The user controls panel will appear (image below).

Step 2: You can then use the filter options to "Include" or "Exclude" the selected value or use the "Create Custom Filter..." to search and select for specific values to include or exclude.
Once you have the data you want, you can change the output from HTML to Excel if you need to download the results.
Scheduling Reports
Reports can be schedule to run on a specific day, time or cadence.
Step by step instructions are available on the UC San Diego Services & Support Knowledge Base Article: “Cognos: How to Schedule Report Distribution”.
Saving Prompts
See Creating a Report View in the "Save As" vs "Save As Report View" section.